Integrated Urban Modelling
This is a summary of a number of issues around Integrated Urban Modelling presented and discussed in sessions at the BRE Cities Convention, Modelling World 2015, the Future of Wireless International Conference and in the paper: “Integrated sub-regional planning informed by weighted spatial network models: the case of Jeddah Sub-regional system”, (co-authored with Dr Kayvan Karimi and Abhimanyu Acharya) and presented at the 10th Space Syntax Symposium. Presentations can be found on the relevant websites.
Introduction
The starting point to this is to explain a bit more about what an Integrated Urban Model is, and why we need to make one.
First of all, an Integrated Urban Model combines many urban systems and networks in the same digital model.
In this case I’m going to talk about combining the spatial network – including vehicle and pedestrian networks – with public transport, census (population), economic (employment) and land use data.
So why should we make an Integrated Urban Model? The context for this model is that it’s taking place within the space of planning and urban design. It’s a model to help designers analyse existing conditions, come up with solutions and to test them.
Urban Challenges
In terms of developing a model there are a number of challenges that arise within this context:
The starting point is the challenge of the project – in this case how to accommodate major population growth. The example I’m using has growth of 3m new residents forecast over the next 20 years, so the questions are how can a city which already has many problems (congestion, under provision of utilities/social infrastructure), accommodate this growth without becoming more difficult to move through, more polluted and making people more unhappy.
These challenges impact the way the model is put together, in terms of how easily population increase and physical city growth can be included in a model and re-tested.
Industry Challenges
One of the key industry challenges is the approach to planning. Things have moved on from single use zoned areas, linked by motorways, to an the approach which is now much more integrated in terms of considering the relationships between urban systems and the impacts of systems and infrastructures on each other.
However, there is still the problem that disciplines (and municipal departments) work in isolated siloes from each other. A design team and city may have the aspiration to integrate systems, but as disciplines have become more sophisticated, the tools they use, and the data required to feed them, has become more specialist too.
This makes linking tools, models and data together more difficult. Even if a city has the aspiration to become more integrated it may not have the tools, or datasets to do so.
Opportunities
We’re at a point now where there seems to be a shift in people’s awareness of data and modelling. Partly this has come from the day to day visibility of big data, but it is also more familiar in people’s day to day life through the everyday availability of technology such as smart phone apps, gps etc.
Lots of data is available on a scale and resolution that hasn’t been previously, but if it can’t talk to each other, the professional and administrative silos are retained, and we’ll continue to create unintegrated solutions that repeat typical urban problems.
How can this be resolved?
We’re at a point where there is major opportunity to build on current awareness and momentum, as well as a major need to improve cities, but the question is how to combine and use this data to help resolve the urban and industry challenges.
Our (Space Syntax) approach has been to treat space as core infrastructure – both in terms of the way a city works, and in terms of the way a model and datasets are structured.
I’m going to show an example of how we’ve made an Integrated Urban Model in Jeddah, Saudi Arabia. This won’t talk much about the project itself but will focus on the modelling approach and issues.
Space as infrastructure 1 (how cities work)
Space is important. By space I mean the network of streets and public spaces that everyone can access.
It’s the place where people come in to contact with each other, use to get to work, meet friends, have lunch or go shopping.
Cities are basically big networks of space that create more (unplanned) opportunities for people to come into contact with each other.
Spatial networks can be modelled, analysed and a number of urban characteristics predicted – including pedestrian and vehicular movement, land use, land value. This has been shown by academic research gathered over more than 25 years.
Once the spatial network is in place, it’s very difficult to change: it’s embedded in land ownerships, administrative boundaries, and it carries a lot of other infrastructure networks, utilities and communication systems.
From the urban point, space is so fundamental to the way a city works, and so difficult to change it should be considered as a core urban infrastructure.
Space as infrastructure 2 (how models work)
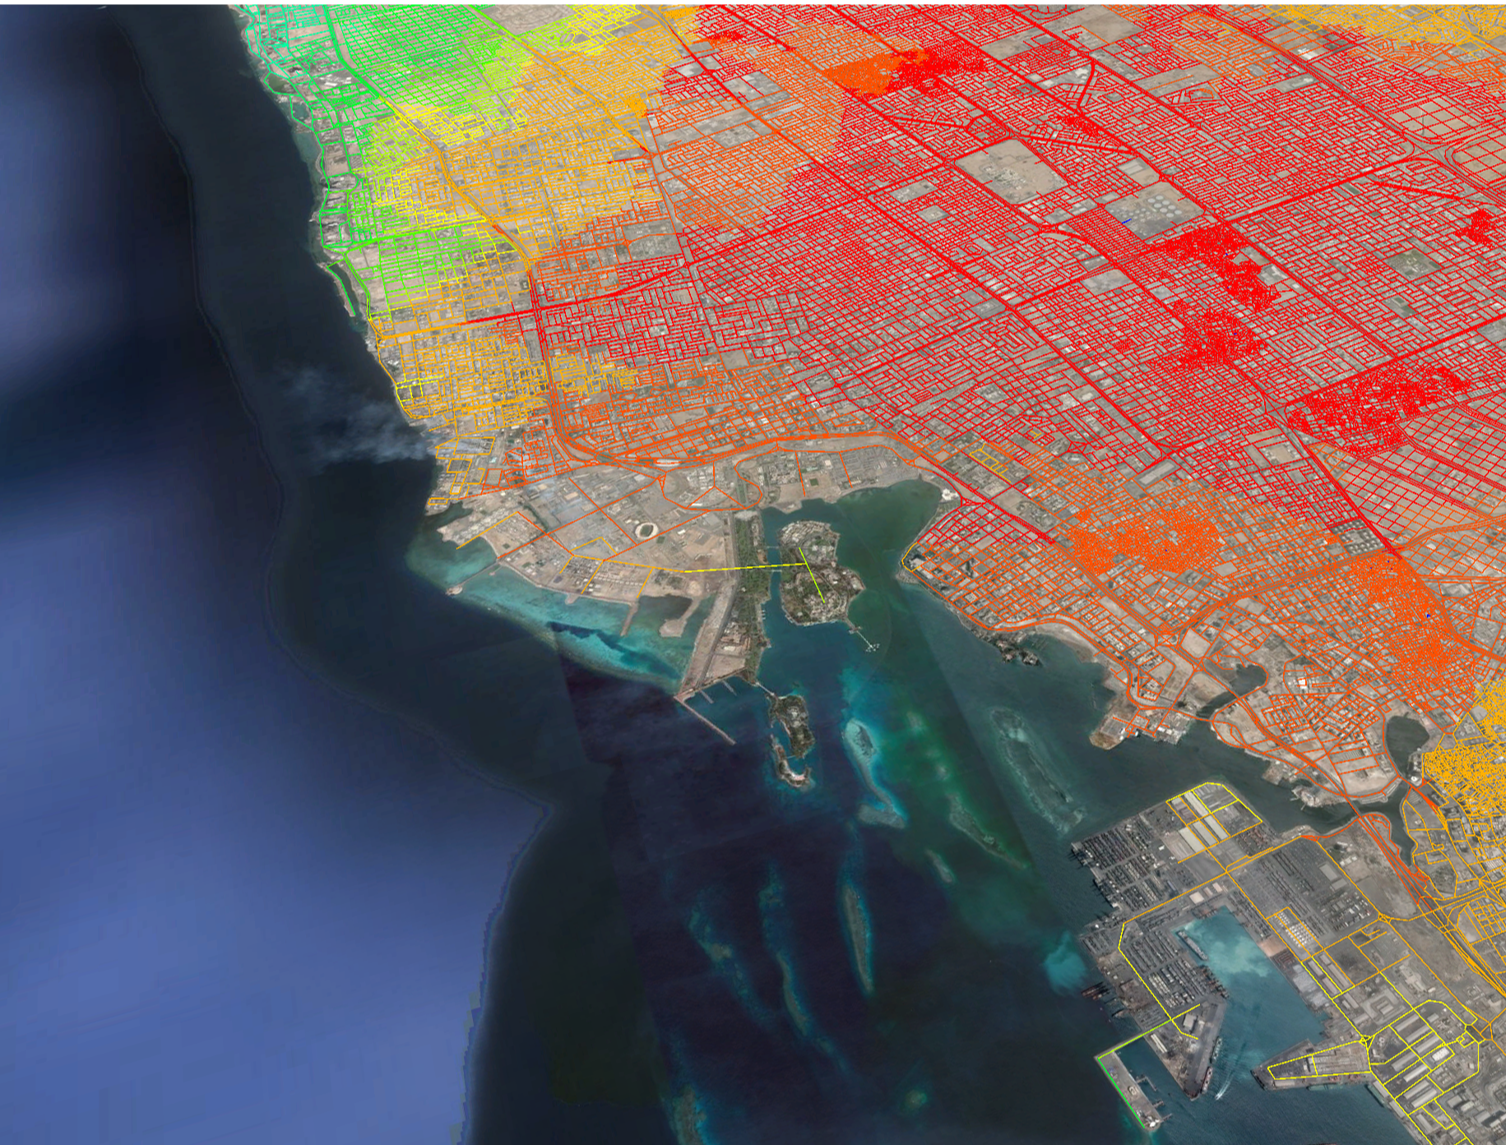
As a starting point we have a Space Syntax model of the spatial network, in to which we are going to add additional data.
Why do we want to do this? Within this project the urban components to consider changing include distributions of population, employment, and the public transport and spatial networks.
We may want to make changes to each of these components individually – such as increasing population or employment density without changing the spatial network, or change all of them simultaneously.
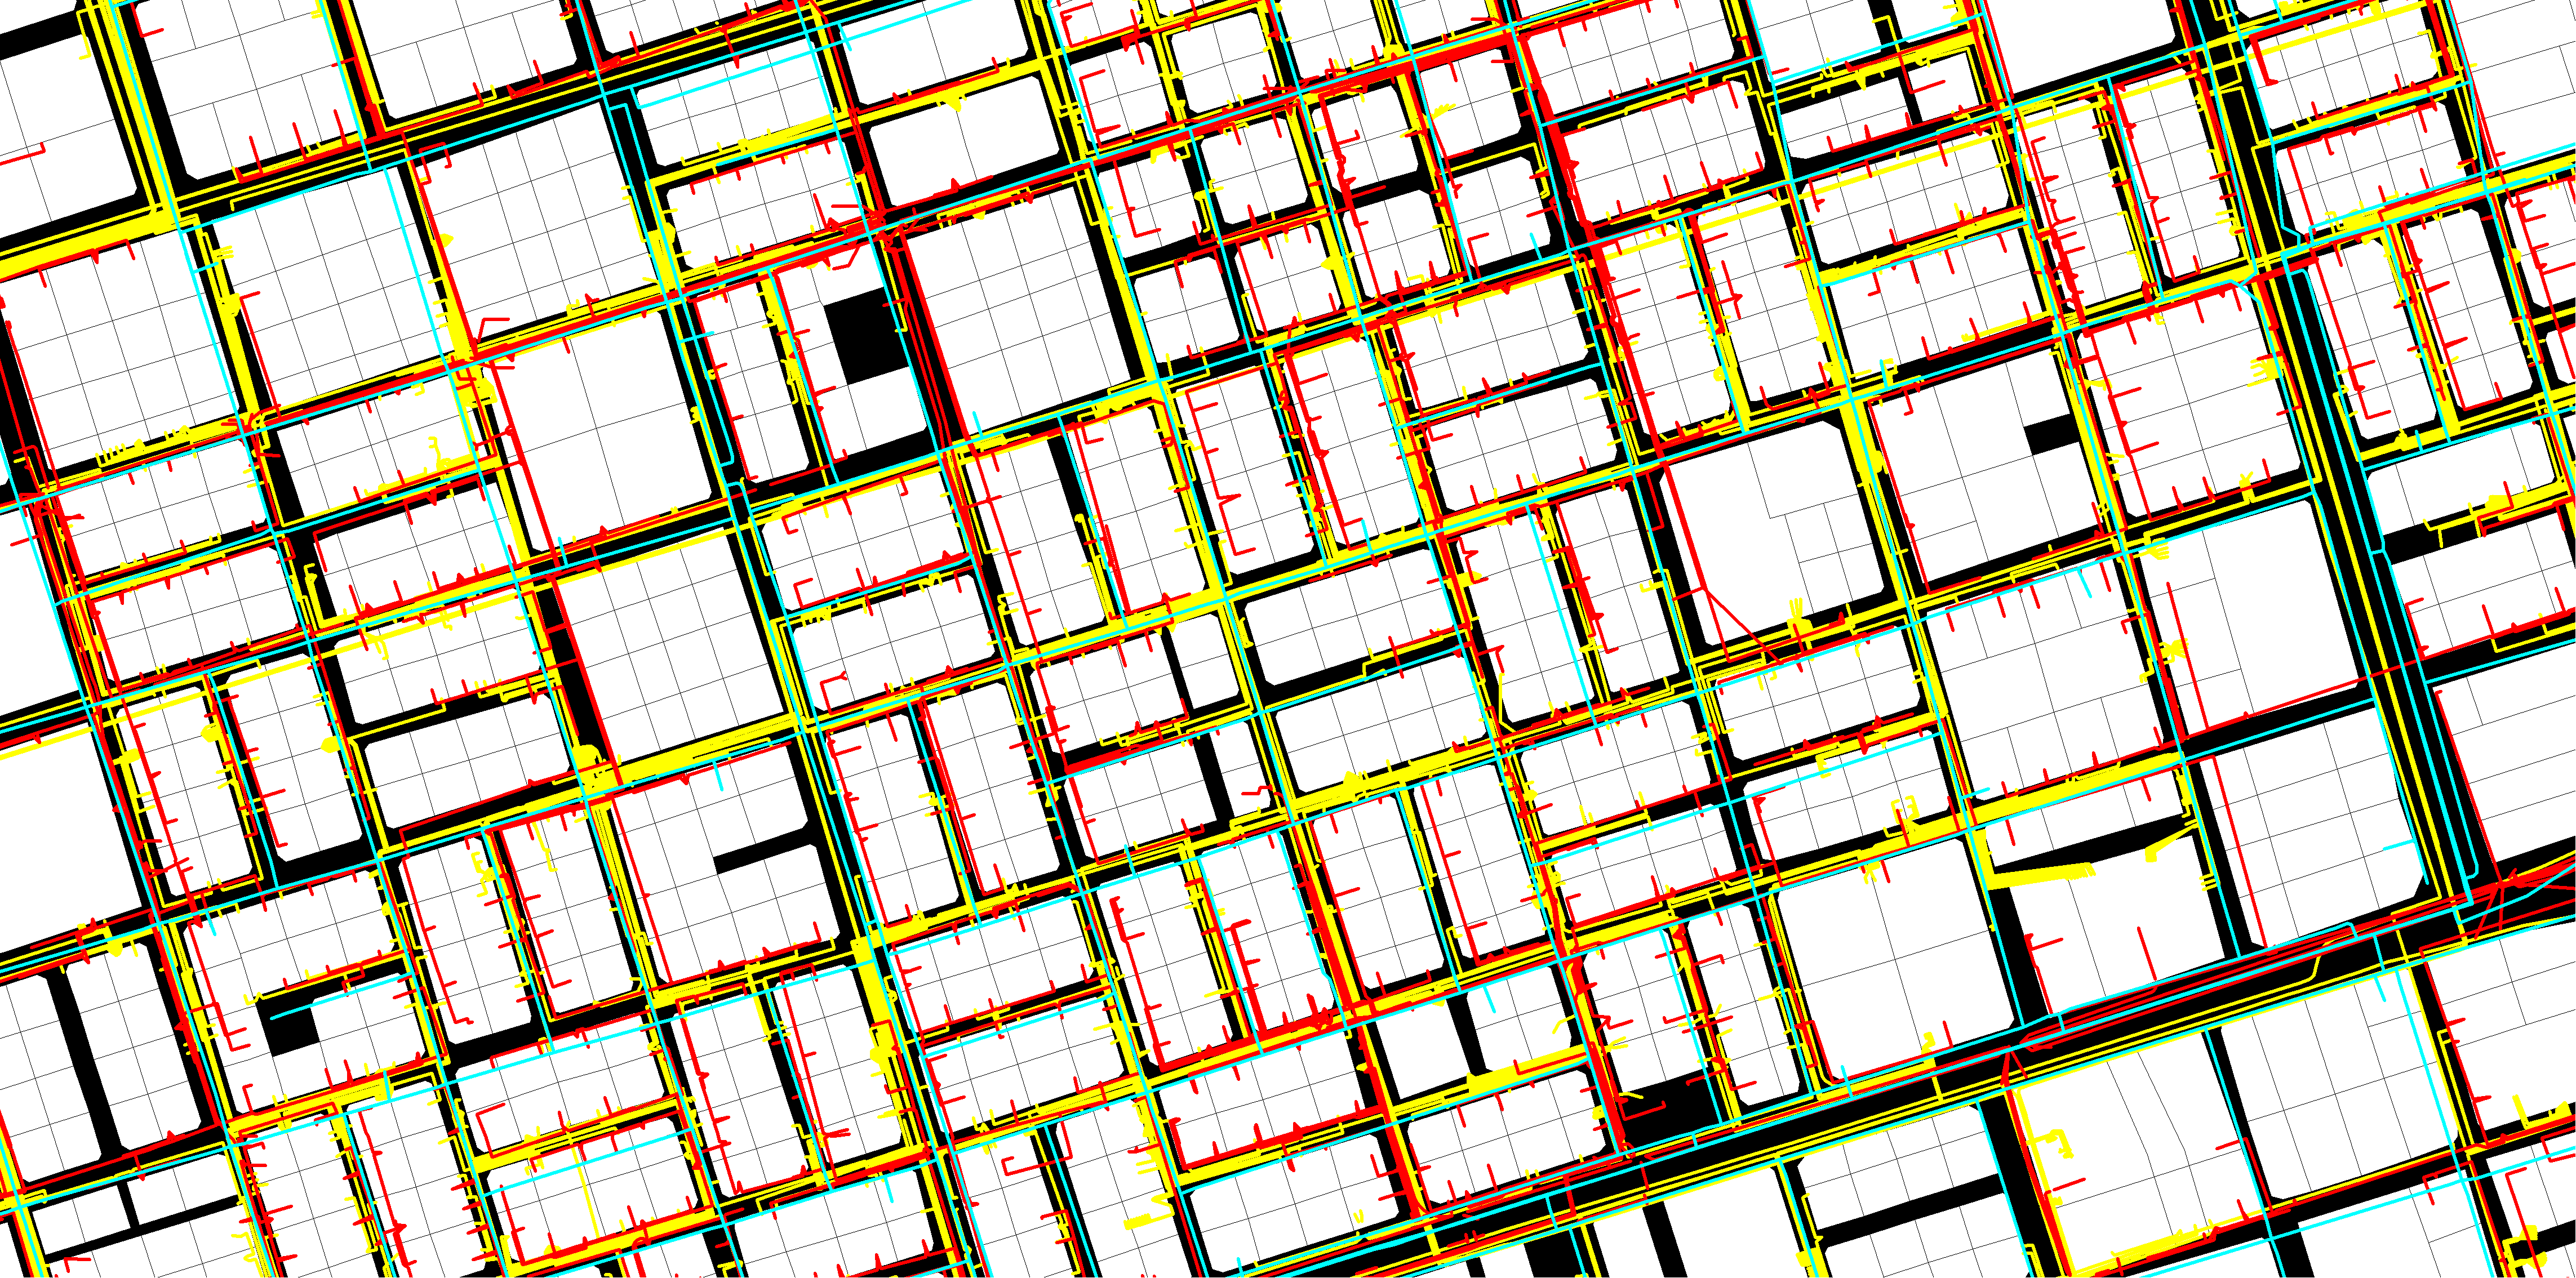
To do this we need to link datasets in the model.
Much of the data we received was in very different forms (some abstract, some spatialized but at varying granularities): census, growth forecast, GIS land use, basemap etc.
The approach we’re using is to take a spatial network model of all publicly accessible spaces, and assign data to each space. This data then gets used to “weight” each space when it is analysed.
The general process is to link people (population and employment) to plots using land use. Land use can then be linked to the spaces it connects to.
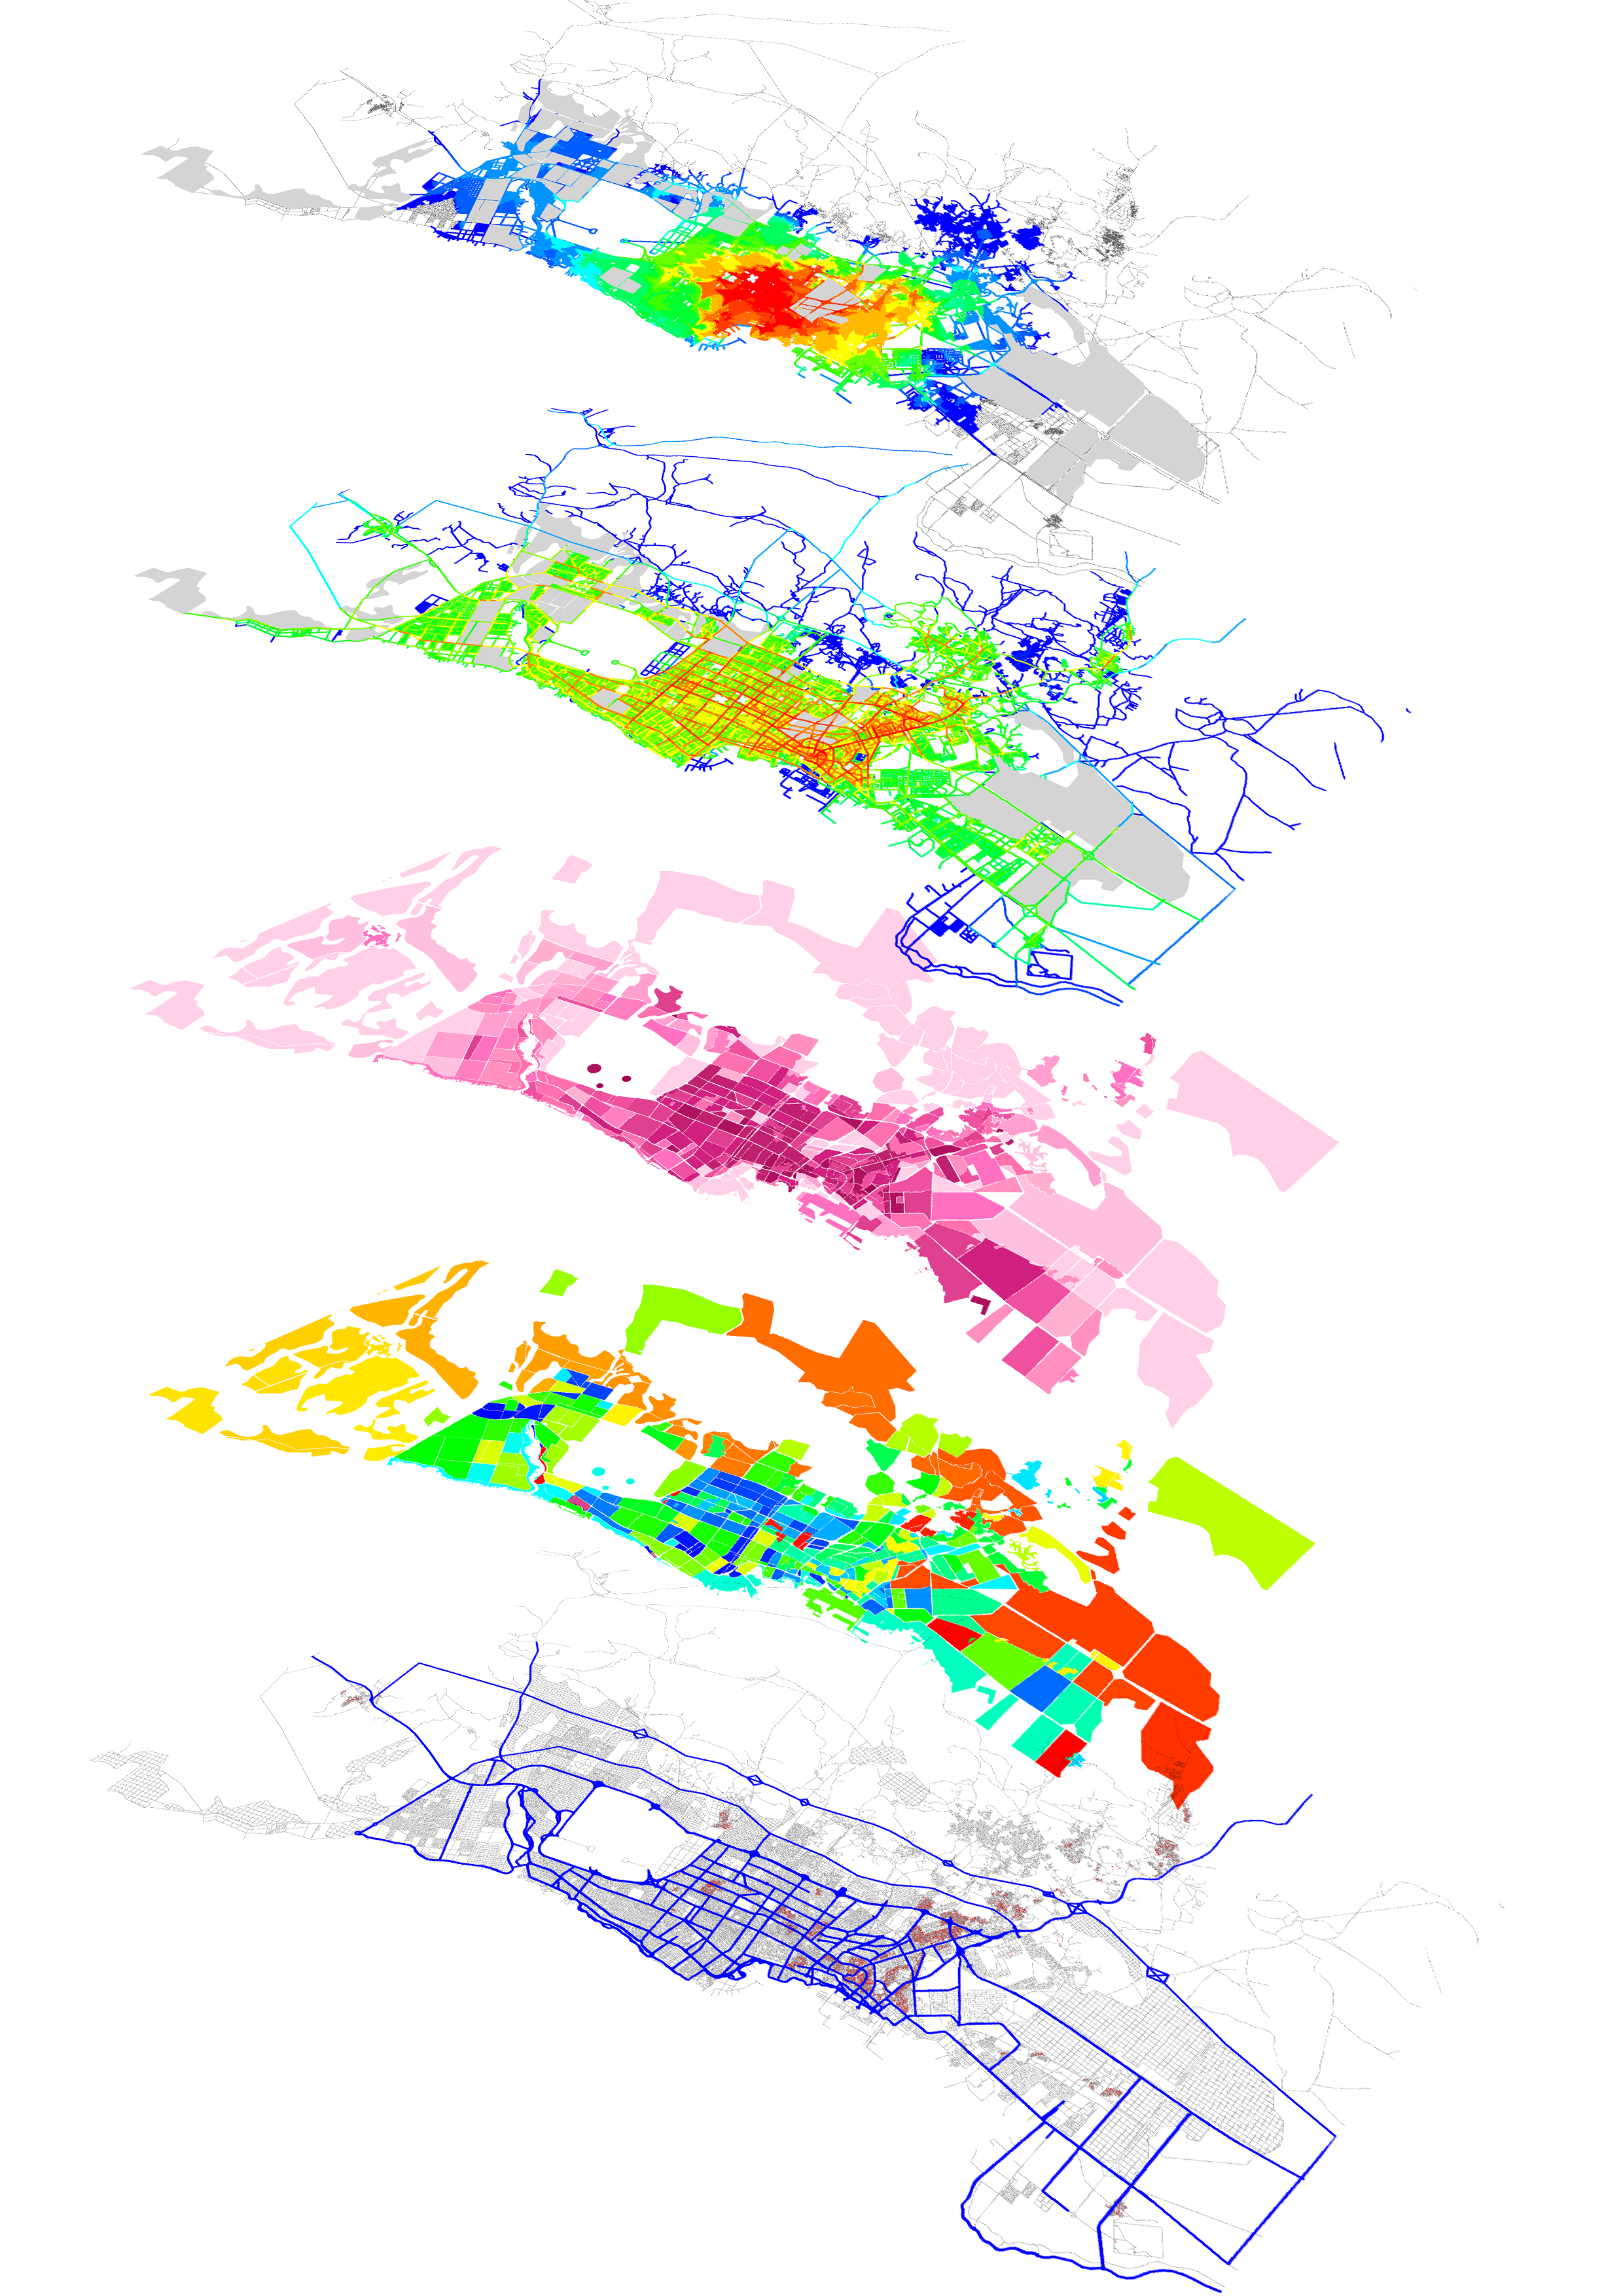
Assigning data to superblocks
At this stage we’re working at a very large scale to understand the whole city and region. Although data has been assigned to the plot level, and could be assigned to the space, we actually didn’t want to go down to this level. The reason is that it affects how changes to the model are made, which are too detailed for this stage of the planning process and makes working with the models very time consuming.
To get round these issues we broke the city into “superblocks”. Superblocks are defined spatially by existing city characteristics. In comparison to breaking the city into similarly sized population groupings this means that the superblocks map on to clear boundaries in the city that can be experienced on the ground.
We identify super blocks using a spatial measure and break down further where we knew major developments are proposed or where there were very clearly different morphologies.
We then aggregate land use areas in each superblock, and based on some city wide assumptions, assign population and employment from census data to each super block.
Spaces also have a typical speed assigned to them based on road hierarchy or public transport so that we can use them to calculate time-based analyses.
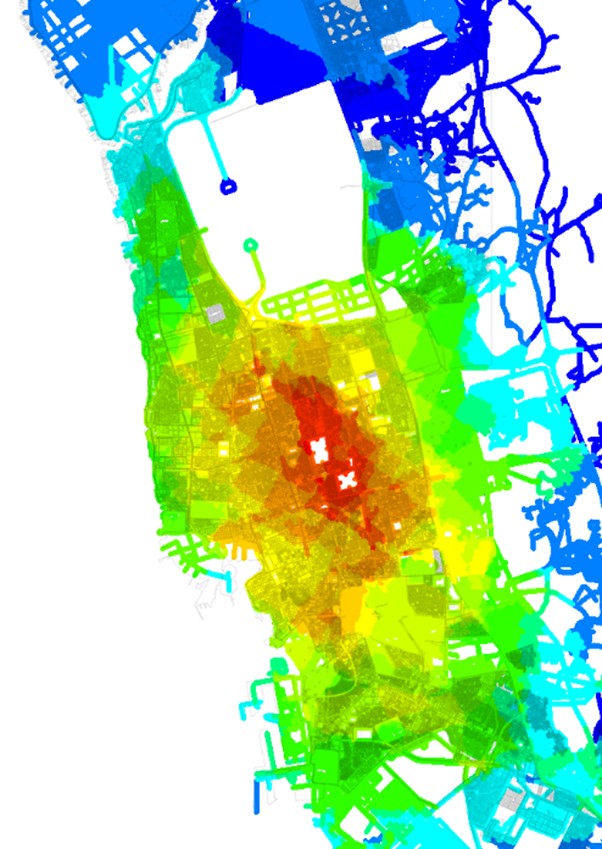
This model can be analysed in lots of different ways to look at how much stress could be placed on streets, where the most integrated points are to concentrate growth, and to look at population catchments within defined travel times.
We wanted to use the model to look at the impact of large scale changes on the wider city. Through the process of assigning census data there will be some inaccuracies, but putting this in the context of the scale of growth, and at the scale of the region, it’s at a level that we’re happy with it.
Extreme morphologies
This approach has also allowed us to find a way to work around some of the characteristics Space Syntax modelling sometimes struggles with. In particular extreme morphologies – these don’t tend to be such an issue in more developed cities, but in places which have grown rapidly and we’re looking at them during a transitionary phase, there can be unusual characteristics.
Space Syntax models analyse relationships between all spaces in a network. At its most basic, the starting point is that all spaces have an equal weight in the model. By weighting spaces with people it means we have a way to work around some of the issues this can create: two areas that have the same population but have different numbers of spaces, two areas that have the same number of spaces but different populations, and spaces where there are no land use.
Integrated Urban Model
 Now we have a single model which includes data that is familiar to many disciplines (including planners, economists, transport planners) which starts to address the silo effect.
In making this model we have also spatialized a lot of data that offers new insight from its original form.
Now space has now become the core infrastructure of the model as well as the city itself.
How did we use the model?
The Integrated Urban Model was used to support the design process and also to inform stakeholder decision making.
The design principle guiding the project was to concentrate growth in a network of mixed-use, higher density centres.
The model was used to identify the locations that have the strongest spatial conditions to become centres.
This included testing which parts of the city were best connected across many scales, including through public transport, and combining this with other considerations such as which had most vacant land, more existing jobs etc.
Working with the design team we identified a series of potential centres and ranked them.
Impact testing and stakeholder engagement
 Once proposal options were developed, the model was use to impact test and benchmark proposals.
We defined a series of indicators that would be relevant to the day to day lives of people in the City.
So rather than talking technically as we do within in a design team about how accessible or integrated a centre is, we were able to use the model to say how many centres, and therefore opportunities for employment, education, or health facilities, were within 15 minutes of every plot.
This can be shown on a thematic map, which gives a visual understanding of results, but we can also extract the numeric data and show how all options compare against each other numerically.
Conclusion and moving forward
This approach has allowed us to start to respond to the urban and industry challenges mentioned at the start – we’re using an integrated model, to combine disciplines, and look at how urban systems impact on each other.
We can only do this by combining datasets, and a lot of the processes applied here have been along the lines of workarounds involving manual assignment and assumptions, rather than software solutions.
The opportunity of a fully connected wireless world is to collect data at a scale, resolution and frequency that was previously impossible. This means it should be possible to see patterns of (anonymised) movement across an entire city for the whole day or whole year. The real question though is what the best use of this data is, and what we actually need to make cities better without trying to pre-plan every last action and interaction.
All images produced by Space Syntax Limited 2014
