Socio-economic and spatial relationships in Agra’s slums
This study uses the findings from the field work of London Metropolitan University student’s to ask whether the socio-economic segregation which has been observed at the wider scale in other Indian cities is also reflected in Agra’s slums. Linking these findings with spatial analysis shows that micro-scale patterns of activity and occupation within slums are closely related to local spatial structures. The paper discusses whether the spatial mechanisms which allow a highly segregated society to live within close physical proximity to each other – and which brings economic and environmental benefits in these circumstances – can off set the longer-term impact of social segregation.
This text has been extracted from a longer paper published as part of the 8th Space Syntax Symposium that took place in Chile in January 2012 (www.sss8.cl).
1.0 Introduction
This paper aims to link three areas of study which have been carried out separately over the last five years, to help further develop the spatial understanding of slums and informal settlements.
In late 2010, an opportunity arose to study Agra, and some of its 350+ slums. This study was carried out remotely to contribute to the work of students in the Architecture of Rapid Growth and Scarce Resource (ARGSR) studio at the London Metropolitan University (LMU), who were based in Agra for a period of time. Through a process of literature review, the study was developed further to test whether the relationships identified between the socio-economic segregation of inhabitants by Caste at the scale of the city (Vithayathil, Singh, 2011), and in Delhi, at the scale of the ward (Dupont, 2002), are also present in Agra. It also provided the chance to understand whether there are any further relationships to the local scale spatial structure of slum areas.
The final part uses the findings of a literature review (where relationships between Caste and slum occupant are identified at the scale of the city and the ward), and the results of spatial analysis, to compare them with qualitative, observational, socio-economic surveys carried out by ARGSR students from a set of six case study areas.
2.0 Socio-economic and spatial relationships in Agra’s slums
Six areas (chosen by students at ARGSR) form the basis for further study of the relationships between socio-economic and spatial conditions (Figure 1). Within the six study areas many interesting conditions were observed which relate the Indian Caste system to use of the local scale spatial structure of the area.
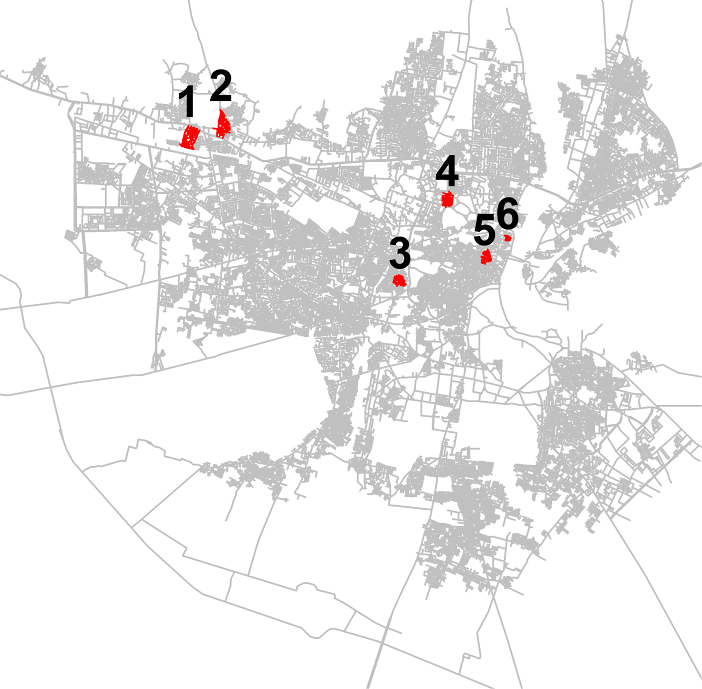
Figure 1: Six study area slums.
2.1 City-scale social segregation
The Indian Caste system is complex and ancient, developing from Hindu religious practices that define groups and sub-groups based on occupational categories. There are five main groups which define the “upper and middle classes” – Brahmins (priests), Kshatriyas (warriors) and Vaishyas (traders) – the “backwards classes” – Shudras (workers) – and the “out castes” – Harijans/Untouchables (cleaners, butchers). Caste groups were associated with professions, some of which were seen as being unhygienic or unclean, and for this reason some Caste groups were often located in areas of the city separate from the other groups (Vithayathil, 2011).
This can still be seen by the way slum areas are populated by different groups: In Delhi, socio-economic data at the scale of the planning ward shows relationships between the occupants of slums and their Caste, where the distribution of Outcaste groups is often between three and four times higher in slum areas than planned areas – some slum area populations are formed by more than 65% from the Outcaste group (Dupont, 2002). While Caste plays less of a role in the daily lives of the upper and middle classes, there is evidence that it still plays a major role in the employment, education and living conditions of the lower groups (Vithayathil, 2011).
To understand whether these patterns exist in Agra presents many problems; accurate and detailed socio-economic data for Agra is even more difficult to collect than physical data – especially across more than 350 areas. Quantitative data collection requires large sample sizes, a carefully designed questionnaire which can be interpreted consistently and which will provide useful information without causing the subject to feel too uncomfortable to answer, and large amounts of time and personnel to conduct the survey.
2.2 Slum-scale socio-spatial relationships
In the six study areas, socio-economic, physical and functional data was collected qualitatively by LMU students who spent two to three weeks living in Agra and visiting the slum areas each day. Data was collected by developing relationships with residents, engaging in shared cultural activities, carrying out interviews and observing patterns of use, activity and behaviour across the day.
As should now be clear; the study of Agra’s slums presented several problems in relation to data collection. The approach followed here does not create a large enough data set to use for statistical analysis, but it does provide a preliminary understanding of conditions which can be used to outline key issues worthy of further study, and to outline whether similarities to slums in different regions are consistent.
To understand how these relationships occur in Agran slums, the urban forms of these areas needs to be explained in more detail. Across the city, many of the slums and older areas share a characteristic pattern where large urban blocks are broken by a number of narrow Galis (alley ways) running in to them and forming tree like structures which do not penetrate to the other side of the block (Figure 2).
The block edges tend to be where the commercial activities such as shops and in some cases light industry or craft-based activities take place, while the tree structures are where residential uses are concentrated. One of the effects of the tree structures is that they focus activity on the block edges – the lack of connections through the block and weight of origins and destinations created by the Galis increases choice values at a local scale.
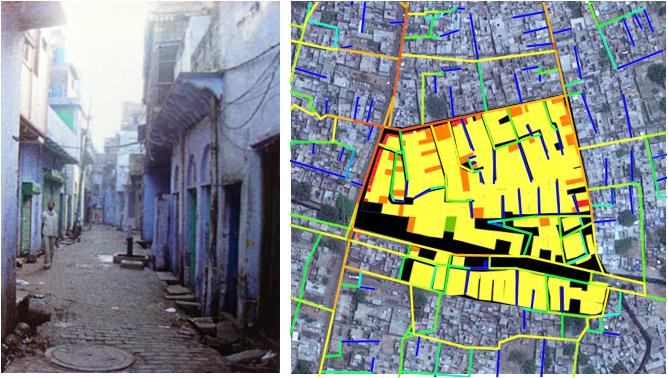
Figure 2: Study area three: urban block morphology – a number of narrow Galis (left) penetrate into the block but do not create a connection to the opposite side. Income generating land uses are typically distributed around the more active block edges, while the centre is used predominantly for private residential uses (right). Red – Shops, Orange – Workshops, Yellow – Residential, Black – Monument, Green – Pig Farm, Blue – Public Toilets. Photo by Emily Broom, LMU
By mapping the Caste of the occupants living on each of the Galis, a further pattern emerges which is that each of the fork structures is populated by members of the same Caste. Study area three can be split by Caste into three areas. The northern most of these areas is occupied by Brahmins/middle class who inhabit a historic part of the city which was built inside and against the internal walls of the city when they were extended in the 1700s. These walls were later removed but the historic alignment of the walls can still be seen in the block structure and boundary between the Brahmin and lower Caste groups.
The settlement topography south of this alignment drops away to a Nala (sewerage canal) that cuts through the remaining area of settlement. The two sides of the Nala are occupied by working class residents on the north side and untouchables on the south side (Figure 3). Living conditions worsen on the southern side, and surveys of individual houses show that most of the occupants live in buildings originally constructed as temporary shelters, formed from a single living space without access to water or sanitation.
Analysis of the spatial structure helps to identify how the spatial device of the Gali works in this context. The settlement can be seen as a set of discrete neighbourhoods where the residential areas are spatially segregated from the wider movement patterns of the city. This means that while residents may live in close physical proximity, perhaps even in buildings which share a party wall, the structure of the settlement means they rarely come in to contact with each other unless on the neutral territory of the commercial edges (Figure 4). This pattern is repeated across the other study area settlements.
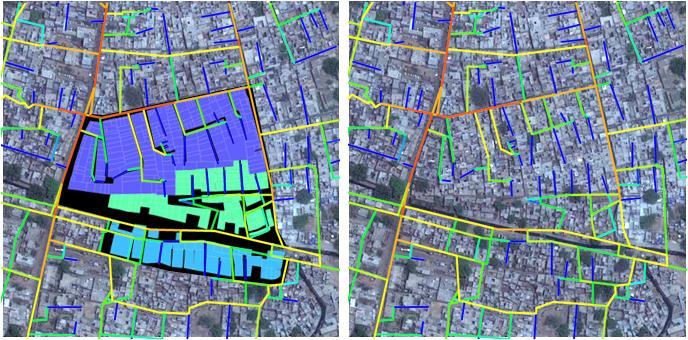
Figure 3: Study area three: distribution of Caste type. Dark Blue – Brahmin, Cyan – Working class, Light Blue – Outcaste
Figure 4: Study area three: choice 400m analysis
Within the same study area, a further characteristic can be seen: each of the Caste group’s Galis focus on a particular edge which strengthens it and gives each group a localised centre. The Brahmins’ centre is the strongest at a local radius, followed by the working class, and finally the Untouchables – where the strongest shared space is the edge of the Nala. The variation of activities that take place on each of these centres reflects the socio-economic circumstances of each group with a concentration of shops along the Brahmins’ centre, craft shops and workshops along the working class’ centre, and no economic activity but only public facilities in the Untouchables’ centre.
This area also provides an interesting example of the Indian desire for residential segregation described earlier. When the old wall of the city was removed, a connection in the form of a Gali connected in to the Brahmin area. The space at the boundary of this connection was used by the Brahmins as a rubbish dumping ground until a large enough obstacle was created to discourage pedestrian movement between the two areas.
These patterns are repeated throughout the six study areas, with different religions also following the same pattern of distribution in discrete areas. In the study areas two and four, the main spine of each settlement, although spatially continuous, is split in to two territories. These territories were defined physically by brightly painted Hindu occupied buildings at one end and more muted Muslim occupied buildings at the other, however it was also reflected as a psychological barrier in the behaviour of the local children – most of the time, students of ARGSR were followed by groups of Hindu children eager to be involved in whatever was happening, at the point of the boundary however, children would refuse to cross in to what was perceived as another territory. The split in territories can be identified in the model at a very small radius (100m) which reflect the clustering of Caste group Galis around particular areas (see Figures 5 and 6).
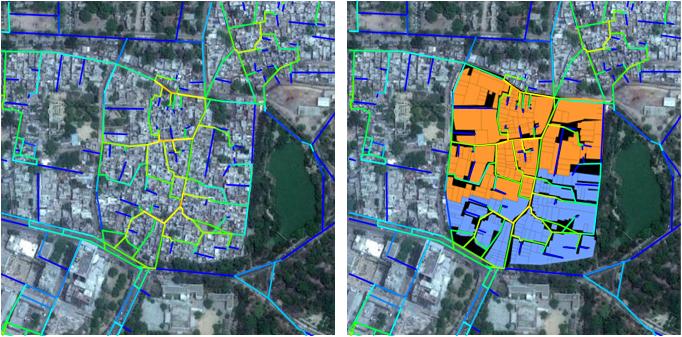
Figure 5: Study area four: Choice analysis radius 100m and religion – Small centres can be seen to the North and South of the central spine which function as the commercial and cultural centres for each of the two religious groups.
Figure 6: Study area four: Religious territories, Orange – Hindu, Blue – Muslim
Finally, further relationships can be seen in the use of space by different gender groups. In all six of the slums (except study area one) it was observed that men would leave home to go to work during the day and return in the evening. When the men were present in the settlement they would populate the Gali spaces outside their properties, using them as an extension of their homes. During this time the women would remain inside, however when the men were at work, the Gali spaces would be empty for a brief period before being re-populated by the women carrying out house work and socialising. During the evenings, when the men returned home the pattern would revert, and women were reluctant to be seen outside of their houses. To overcome the social pressure not to be seen walking alone in the evenings, the local women would move around across building rooftops.
Without the segregation provided by the Gali, or the roof top network, the women may have found the social stigma of being seen out of the house so great that they may not have left it at all. In this context the segregated network is a complex condition: while it does emphasise differences between groups which reinforce long-term prejudices, it also provides easily controlled spatial structures which can be adapted by different user groups over the course of a day. Removing this segregation could, over the long-term, encourage movement through different areas and improve familiarity between groups, however in the short-term, it could also prevent some groups (such as women) going about their daily lives as they usually would.
3.0 Summary
Using spatial analysis to look at the socio-spatial relationships within the six study areas, it can be argued that the spatial and socio-economic segregation of slum dwellers observed at the scale of the City and the Ward, also happens at the scale of the Slum, and is emphasised through the spatial device of the Gali.
In the case of Agra, this is evidenced through the changing use of space by particular social groups, and these groups are defined not only by Caste, but also by religion and gender. Spatial analysis of the slum areas at very local scales (100m) is able to pick out localised centres which act as focal points for these social groups, and which would in turn indicate that the structure of the city has evolved to retain these separations.
It can be argued that the Caste system is older than much of the urban fabric of Agra, and so played a more influential role in shaping the current morphology. This morphology multiplies the social divisions – and there is evidence that in some areas it is being consciously manipulated to reinforce these divisions – which handicap those at the bottom. While the disadvantages that the segregation creates are clear, there is one major advantage to the current form; inhabitants within a very conservative, clearly defined social structure, can live in close physical proximity to each other, allowing the sharing of resource and transfer of goods and services, while only coming into physical contact with each other in agreed spaces.
Acknowledgements
Maurice Mitchell, Robert Barnes and the students of the Architecture of Rapid Growth and Scarce Resource studio at the London Metropolitan University.
References
Davis, M, 2006, Planet of slums, Verso
Dupont, V, 2002, Socio-spatial differentiation and residential segregation in Delhi: a question of scale? Elsevier
Greene, M, 2003, Housing and community consolidation in informal settlements: A case of movement economy
Hillier, B, 2009, Spatial sustainability in cities: Organic patterns and sustainable forms
Karimi, K, Amir, Abdulgader, Shafei, K, Raford, N, Abdul, E, Zhang, J, Mavridou, M, 2007, Evidence-based spatial intervention for regeneration of informal settlements: the case of Jeddah central unplanned areas
UNCHS (Habitat), 2003, The challenge of slums: Global report on human settlements, Earthscan Publication Ltd.London.
Vithayathil, T and Singh, G, 2011, Spaces of discrimination: residential segregation in Indian Cities
