Why data on city systems is as important as data on outcomes
There are lots of interesting things going on using data in cities at the moment. Many articles and blog posts talk about how data, and open data in particular, has the potential to deliver public services better, start to address long-term outcomes (such as health problems), and create a basis for decision-making. In times when public sector funding is under pressure delivering these outcomes is even more important than normal.
Collecting data in cities is helpful as it provides something to measure progress against. It means measuring specific outcomes, which also means being very precise about what outcomes are important.
It can also be a link between deciding a wider objective (improve air quality) and a specific implementable actions (make public transport free). However, to do this requires both domain and data expertise:
- to understand the difference between data on the outcomes of a system, and the variables in that system
- to measure and analyse the urban systems that form the variables
- to know how data is recorded on urban systems and what it actually represents
Outcomes and variables
To make the most of this opportunity, it is important to look at cities themselves in the right way. This means understanding what data describes the outcome of interactions between urban systems, and what data describes the urban systems themselves.
At the level of secondary school chemistry – or at least secondary school chemistry in the mid-1990s – this is the difference between the amounts of different chemicals combined (the variables); and the PH level produced by mixing them (the outcome).
In cities, this is more complex. Cities combine physical, social, economic and political systems. Each of these can be broken down further; physical systems combine land use, density, street network etc. Each of these sub-components will interact with other physical components, although not every component will be equally influential. To make things more complex these physical systems will interact with non-physical systems.
As an example, the patterns of connectivity in the network of streets make certain places easier to get to than others. They also make certain routes easier to follow. More people use these routes, and this creates opportunities for uses like shops. If a street is blocked, the easiest route changes, fewer people use the original route, and the reduction in people may mean the shop goes out of business. This is Bill Hillier’s Theory of the Movement Economy.
So some physical systems are more influential, while some are more reliant on others.
Where this becomes complex, is that wider socio-economic conditions will also affect these. Changes to the wider economy may mean that shops can no longer survive, even if there has been no change to the physical environment (see images below 2008 and 2016).
However, what can be argued is that, if the physical conditions are not in place – the right street network etc – then regardless of economic conditions, the required numbers of potential customers won’t walk or move through particular areas.
So comparing the number of vacant shop units is an outcome of a series of systems. It is useful as an indicator that something may be happening in the wider urban systems that affect economic sustainablity, but it doesn’t explain how to change it.


Data on the urban systems (the variables)
Describing a system itself is very difficult and needs a level of domain expertise. Describing the interactions between systems is even more difficult. As a result, the open data available on a city is often on the outcomes of a city not its systems.
What this could lead to (and this is used purely as a hypothetical example) is data on how many coffee shops there are in an area of town (such as a postcode area) correlated against obesity. If a negative correlation is found, i.e. the more coffee shops the lower the levels of obesity, the easy response to this would be to say “build more coffee shops” as there are fewer obese people when there are more coffee shops.
However, this over simplification effectively compares two outcomes of city systems, not the form of the systems or relationships between them. The coffee shops are likely to be affected by the number of people who pass them (affected by the street network, the surrounding density of population and the disposable income of the population). Obesity is likely to be affected by what these people eat every day and how active they are (again affected by what jobs they do, how they get to work, how much time and money they have to spend on things like the gym).
There are also some systems that a city has more control over than others – effectively land use, density, street and pedestrian networks. It is important that at least the physical systems a city has control over are described in the right way.
This means that physical systems have to be explained objectively, both individually and collectively. In the case of the street network, this means understanding how well connected it is for pedestrians, for cyclists, and for vehicles, how close it is to the centre of the city, and how close to a local centre. For density, it means being able to measure what it is across a city, what it is within a neighbourhood, and what this means in terms of dwellings and population per street.
What then becomes important is to see how these two systems relate to each other. Is there a high density of people, in a part of the city which is very isolated and difficult to get to? How does this then relate to where people need to get to for work or school, and can the people who live in these areas afford the cost of transport?
Even just the physical components of a city are complicated. Cities operate at many different scales all at the same time – how close am I to the centre, how close to a local centre etc. In the past this has been difficult to measure, however the technology exists to process this information on a very large scale and then to query results at a very granular level.
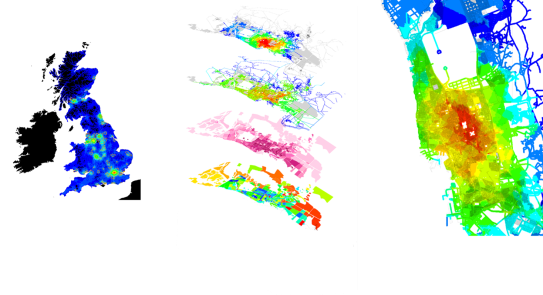
When this understanding of systems is in place (which is where Integrated Urban Models are very helpful – see image below), it can then be compared to the outcome data.
Spatialising city systems data
What is also illustrated from this hypothetical example, is that the exact street a coffee shop is on will be important for business. If it is on a high street it will probably have lots of potential customers walk past, if it is on a side street, there will probably be fewer customers.
Cities are physical environments, and people navigate these environments as physical beings. Spatialising data and geo-referencing it is crucial. But even this is more difficult than it sounds.
Two parallel streets, or perpendicular streets can function in very different ways. However, to protect privacy and make data easier to share, data for each of these streets will typically be aggregated up to a collection of streets. Data is typically grouped up to Postcode or LSOA levels. Alternatively it may be to an unrelated geometry such as a grid which is designed to get around the visual priority given to large areas on maps (which may be misleading).
Interestingly, the Booth maps from around 1900, which map poverty, visualise the data very accurately based not on LSOA or Postcode areas, but on building facades (below left). This is because data was collected manually, which meant someone had to move through the city streets and record the data.
This bottom up collection means that data is collected in a way that describes the different characteristics of two adjoining streets, or two parallel streets or on different sections of the same street.
Postcode areas (below right) are defined to offer efficient ways to collect and deliver post. This means that they will include assumptions about how Royal Mail delivers post, and also that they may change if density (the number of addresses) changes. This indicates that the boundaries themselves are the outcome of other urban systems (density, land use and street network) and viewing data through this boundary could skew results.
From a statistical point, convex boundaries mean that the differences observable between streets will not be truly represented in the data. It effectively averages out the better and worse elements.
Privacy is important, and it may not be possible to provide detailed health outcome data at this level. It is however possible to describe the physical characteristics of the city accurately at this scale, if data is connected properly. This should be using the principles of the Booth map, at least at the level of the street, and should avoid aggregating data up to boundaries that cover wider areas wherever possible. GeoDatabases allow this to be carried out on a large scale that wasn’t previously possible.
The risk of not taking this approach is that the physical systems of better and worse performing areas cannot be understood properly – even to rule out that they are a factor in the outcome. In turn this means that changes to the city cannot be made in relation to the systems that a city could control, and proposed changes are subjective, based on intuition, or biased by the way that data is collected.


Conclusion
While it is difficult to say that change to a city system will definitely lead to certain outcomes, they can at least allow for these outcomes to happen.
It is possible to measure how street networks, land use, density and public transport interact with each other to make certain behaviours more or less difficult – driving to work compared to walking for example – across an entire city, without matching individual people to individual jobs. It is also possible to use ths approach to forecast the impact of future change.
Having the systems in place that make a walkable city doesn’t mean no one will be obese; people still choose what to eat, how much to eat, and how active they are. What it can do though is make the choice of walking to work possible – this isn’t the case in a lot of late 20th and early 21st century urbanism.
To look at a city scientifically, and improve the way it works, the difference in data on urban outcomes and urban variables needs to be understood. This means that data has to be applied through the lens of the city. Each urban system needs to be described and measured consistently by itself. Without doing this, it is not possible to accurately describe the difference between two parts of the same city, or to know how, or why, part of a city should be changed in a particular way.
