National scale modelling to test UK population growth and infrastructure scenarios
This is a research paper I recently presented at the 11th Space Syntax Symposium in Lisbon, co-authored with Stephen Law and Laurens Versluis.
The paper has been reformatted for re-production here and the original published version can be found here .
Abstract
This paper describes an exploratory methodology used to study the national scale issues of population growth and infrastructure implementation across the UK. The project was carried out for the Government Office for Science in 2015, focussing on two key questions: how could a “spatially driven” scenario provoke new thinking on accommodating forecast growth, and; what would be the impact of transport infrastructure investments within this context.
Addressing these questions required the construction of a national scale spatial model that also needed to integrate datasets on population and employment. Models were analysed and profiled initially to identify existing relationships between the distribution of population and employment against the spatial network. Based on these profiles, an experimental methodology was used to firstly identify cities with the potential to accommodate growth, then secondly to allocate additional population proportionally. This raises important questions for discussion around which cities provide the benchmark for growth and why, as well as what the optimal spatial conditions for population growth may be, and how this growth should be accommodated locally.
Later the model was used to study the impact of High Speed Rail. As these proposed infrastructure changes improve service (capacity, frequency, journey time), rather than creating new topological connections, the model was adapted to be able to produce time based catchments as an output. These catchments could then be expressed in terms of the workforce population within an hour of every city (a potential travel to work area), as well as the number of employment opportunities within an hour of every household.
1.0 Introduction
This paper sets out a highly experimental case study application of Space Syntax modelling to real-world, macro-scale, strategic thinking. In 2015 the Government Office for Science Foresight group launched a Future of Cities research programme. This programmed studied all aspects of cities, how they might change, and what the impacts might be with a view to inform decision making at the current time. A Lead Expert Group (LEG), which included Space Syntax Ltd, oversaw the production and publication of a total of 38 Reports, Working Papers and Essays (which can be found at https://www.gov.uk/government/collections/future-of-cities ).
To contribute to LEG workshops focussing on growth and transport infrastructure scenarios, two modelling exercises were undertaken to ask how a “spatially driven” growth scenario could provoke new thinking on accommodating forecast growth, and; what would be the impact of transport infrastructure investments within this context.
These two pieces of work were carried out sequentially, as different studies, and this paper has been structured in two parts to describe each in turn.
The first looks at UK population growth up to 2037, and used a UK wide spatial model to begin to profile existing spatial conditions in order to provoke new thinking on how population growth could be accommodated through existing, unseen, opportunities.
The second study, developed this model in to a more sophisticated Integrated Urban Model, combining multiple transport networks, population and employment data, and assigning speeds to segments to carry out time based analyses.
2.0 Previous research
This study raises questions around relationships between population size and city outcomes. These relationships have been explored in socio-economic terms, however these studies lack the more sophisticated descriptions of space possible using Space Syntax techniques. Cities are not isolated entities but rather they sit within a wider regional and national complex network (Hildreth 2006). Their success in attracting and sustaining people and jobs depends a lot on the linkages that exist between them and to all others (Turok 2004). This is why the space syntax approach to understanding cities as a spatial network is important.
In “The Origins of Scaling in Cities” (Bettencourt, 2012) Bettencourt concludes that a range of outcomes, both positive and negative, are increased disproportionally as population grows. Through analysis of 415 urban areas in the United States, outcomes including GDP, Employment, Patents registered, were seen to scale super linearly, that is at a ratio greater than 1. In contrast to this, UK cities did not consistently follow these patterns (Bettencourt and Lobo, 2016). This was partly as a result of sample size, however Birmingham and Manchester are noted as clear examples where levels of economy and employment are too small in relation to population size. In some regards this is not surprising, US and UK cities have emerged from different social, political and economic contexts, the sample size of UK cities is small (15 cities above 500k), and does not include a spatial characterisation of the city, especially its position within a wider network of smaller towns and settlements. Both of these studies are based on the definition of cities as functional urban areas and do not take into account characteristics of the spatial network or its change in intensity.
Research carried out at UCL (Serra et Al, 2014) showed that there are indeed spatial relationships between UK cities and a range of outcomes: Across the UK, node count at 2km correlates with the distribution of employment, with more jobs found in areas of high node count. The correlation with node count was higher than that between employment and population, indicating that spatial characteristics are a stronger factor in employment distribution than population. The same research also found that population was found to correlate highly with node count at 10km, while affluence as defined by Serra et Al (2014) was found to correlate with node count at 100km.
The findings indicate that spatial conditions across multiple scales should be considered when developing a growth strategy. Further, creating cities that have higher spatial densities at 100km, 10km, and 2km replicates some of the spatial conditions associated with more economic activity, more economic output and more economic affluence.
Further relationships between the spatial characteristics of cities and their economic performance are also set out by Versluis and Law (2015). This study used commuting data collected through the Census to understand movement flows between cities. Whilst strong relationships were found between integration at 5k and both population density (R²=0.83) and workplace density (R²=0.82), there were complexities associated with the specific characteristics of commuter movement: “The difference between being a commuter city (Wigan), a city that attract commuters from nearby (Oxford) or a city that attracts commuters from afar (Norwich) appears to be influenced by the balance of city size, density and its regional connectivity.”
3.0 Part one – UK population growth scenarios
This stage of work concentrated on trying to understand how forecast growth scenarios relate to existing socio economic-patterns, and to develop an alternative spatially driven growth scenario.
The Government Office for Science (GOScience) appointed consultants to develop economically driven population forecasts as an alternative to the official Office for National Statistics (ONS) 2037 growth scenario.
Three further scenarios were generated on the basis of economic analysis:
- Major city empowerment
- London-centric
- Smaller cities driving growth
Spatial modelling was used to visualise the impact of these four growth scenarios. The specifics of these scenarios are not described in any detail in this paper beyond the following critique of their approach:
Current ONS forecasts are based on assigning the level of growth recorded between Censuses to the future. There are many issues with this technique, which include failing to take account of exceptional circumstances, outside influence, or to take any strategic approach to distributing or planning growth. These scenarios do not consider existing relationships to and between concentrations of population or employment, which may already exist where a city is well connected regionally, or if regional scale infrastructure projects such as HS2 or 3 are delivered. The impact of this process is potential inefficiency, or less than optimal results – there may be some parts of the country which have a higher capacity for growth than is being used, while some proposed growth is at risk of failing, or producing less effective economic impacts where it is not supported by the right spatial conditions. Furthermore, growth provides an opportunity to address existing problems in cities, however these will continue to go unaddressed through this approach.
Space Syntax analysis has been used to demonstrate how cities function simultaneously across multiple scales. It was proposed that this understanding of spatial structure at different scales could be profiled against population and used to develop growth scenarios. Some city centres may have a node count at 2km proportionally higher than its population, indicating they could support population growth. This could improve the functioning of the city centre, without requiring major investment in infrastructure. Alternatively, some cities may have very weak core areas, a condition that could be addressed by intervention in the centre. By intensifying or repairing this condition, it would not only improve the existing city but also allow it to accommodate a higher population.
Similar thinking can be applied to the city and regional scales. Some cities could support higher populations in their wider area or hinterland if the connections and structures between them are strong enough. There may also be cities with a suitable balance between centre and urban area, in which case balanced growth is required.
When these opportunities and weaknesses can be seen, decisions can then be made around how growth could be accommodated, and how this might begin to relate to current relationships between cities and networks of cities.
Current growth scenarios, and distributions of population, do not begin to develop this level of specificity in terms of a strategy, nor do they begin to link the implementation of infrastructure to existing opportunities or as catalysts for growth.
A fifth “Spatially driven growth scenario” was therefore proposed by Space Syntax ltd, based on optimising the relationships between existing spatial characteristics and population distribution. This section of the paper explains how this spatially driven growth scenario was developed.
3.1 Methodology
To test how growth scenarios compare to current spatial characteristics a model of the entire UK was constructed using GIS software. This task itself is a major undertaking that was only possible based on the availability of open datasets, and modelling at a suitable level of granularity.
As a base, the OS Meridian Line data set was used. This is very similar to a road centreline map, however motorways and dual carriageways have been simplified to remove complicated motorway junctions and to reduce parallel highway lanes into a single line. This provides a very suitable base to use for Space Syntax modelling where the number of street segments needs to be as few as possible.
To this base, the current inter-city rail network was added. When this mode of transport is used to connect cities, it could be argued that the cognitive process of way finding is different to when people move through a city on foot, by bike or by car. The cost of using this network between cities is less likely to be angular, and more likely to be time based. However, as a purely spatial model was being used at this point these connections were added to reflect the topological nature of the direct link between stations. To reflect this, these connections were added in to the model so that they directly connect the locations of each station instead of following the exact path of the railway between stations, which would increase the number of segments in the model and add angular cost. For example, London St Pancras is connected by a single line to Birmingham New Street, effectively making them one step from each other. It should be noted that this would not now allow the same model to be used to process choice measures, and these were created in a model only including the road network.
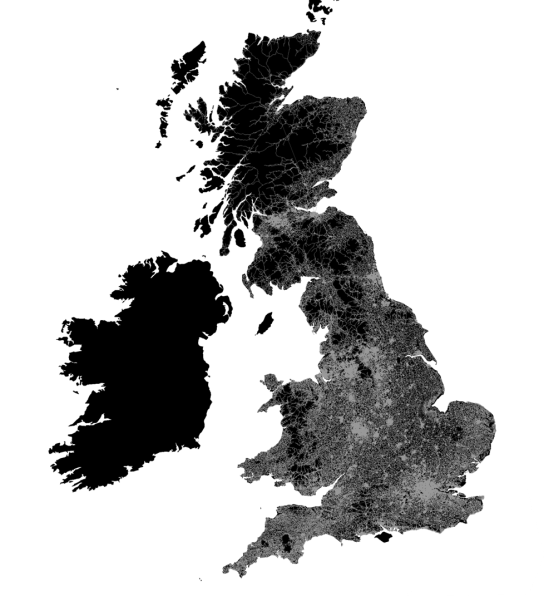
Fig 1. Unprocessed spatial network model of UK created from OS Meridian Line data.
The models were processed using Depthmap. For this piece of work the measure of node count was used across many scales (2k, 5k, 10k, 20k, 50k, 100k).
A period of exploration then used these measures to profile the spatial characteristics of cities against other socio-economic datasets. These socio-economic datasets were provided at the level of the Primary Urban Area (PUA), which required them to be combined with the spatial model. There is a major mis-match in the granularity of data provided at the PUA level (which is coarse), and the spatial model (which is fine). One of the core issues is that the PUA boundaries do not accurately or consistently follow urban form. To combine these datasets, further exploration was carried out in to the way that cities can be spatially defined, and how closely these definitions relate to the PUA boundaries.
PUA boundaries are defined by taking areas where buildings are within 200m of another building, and then adjusting these boundaries to Local Authorities. As a result, some PUAs do not logically follow the built form of the city. Norwich (shown below) covers a very large area with the city itself occupying a very small part of this. The spatially contiguous form of Manchester is split into five smaller PUAs, while the built form of Bristol lies half inside and half outside a PUA.
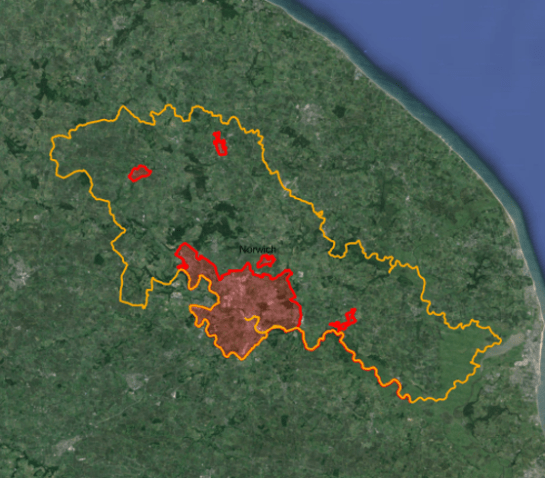
Fig 2. Norwich PUA boundary (shown orange). The urban extent of Norwich (outlined in red) is only a very small proportion of the PUA.
The clearest physical definitions of cities were formed by combining a measure of node count with a measure of population density, collected at the Lower Super Output Area (LSOA) level. Identifying segments that measured a node count of more than 100 segments at 2km, and which also recorded population densities above 5 p/ha, produced a more visually accurate description of urban form. When the population within the LSOAs identified by this method were aggregated they were found to correlate very strongly with the population of the PUA, meaning that these definitions could be used to profile spatial characteristics more precisely if required. However, while this approach defined cities more clearly, these boundaries could not be combined with any socio-economic datasets.
As the PUA boundaries were retained, spatial data had to be assigned to these boundaries. A number of methods were tested to identify the best way to aggregate spatial data, and included using the maximum, minimum or average value of segments within the PUA. Through testing, the sum of all segment values within the boundary gave the strongest correlations against factors such as population.
3.2 Existing results
The combined model (meridian line plus strategic rail connections) was able to replicate the findings of Serra et Al 2014.
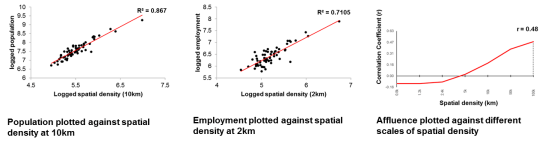
Fig 3. Scatters of population vs node count (left), employment density vs node count (centre) and affluence vs node count (right), Serra et Al (2014).
In addition some further analysis was briefly carried out. This identified a correlation of 0.76 (R2) between node count at 10km and Gross Value Added (GVA). GVA, as defined by the ONS, measures the contribution to the economy of each individual producer, industry, or sector in the UK.
Population Density, as opposed to Population, was seen to correlate highly against node count at 2km.
3.3 Generating a growth scenario
An alternative “spatially driven scenario” was developed based on matching the spatial characteristics of PUAs to future population.
Existing PUA populations were profiled against node counts at 100km, 10km and 2km. Population is always shown on the y axis while node count is always shown on the x axis. The red line identifies the line of best fit. These scatters formed a baseline to compare scenarios against.

Fig 4. Scatterplots profiling UK PUA population against node count at 100km (left), 10km (centre) and 2km (right)
Across all scales London is consistently above the line of best fit, indicating its population is very high in relation to node count. The scale that this difference is greatest is at 100km.
This begins a discussion around how a strategy could start to respond to existing conditions, and specifically, not just where should new growth be accommodated, but what can be done to make existing cities better.
Where a city falls on the line of best fit it indicates that population size is proportional to the node count of the city at that scale. Where a city is below the red line, it shows that the city has a high node count, but that the population size is not proportional. These cities have capacity to grow.
Where a city is above the red line, it indicates that the population is proportionally higher than the node count. These cities require changes within the spatial network to allow the city to function efficiently. This change could include regional infrastructure connections, urban extension, better connections from the city to its centre, or improvement of the centre itself. These changes need to be made before these cities can be considered for growth.
Scatters were generated in sequence from regional (100km), to city (10km) to centre (2km) scales. Populations were increased proportionally for the regional scale, before re-profiling the new population against 10km, assigning more population change, then re-profiling the updated population against 2km and repeating the proportional allocation.
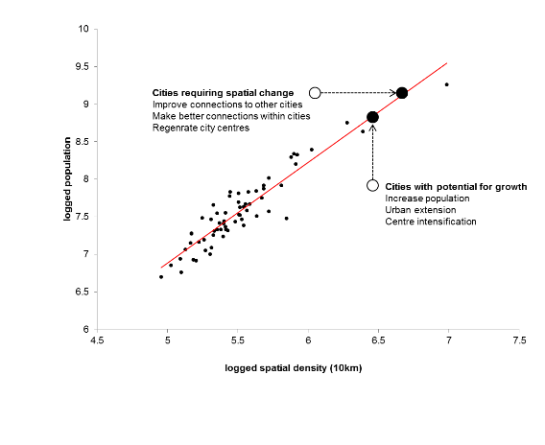
Fig 5. Principle behind distributing growth is to take all PUAs below the red line, and increase their population until they intersect with the line of best fit. This process starts using node count at 100km, and is then repeated for 10km and 2km, updating the population and re-profiling it at each scale.
The model was then updated to include HS2 and HS3, to see what opportunities will emerge further ahead in the future.
The total population increase accommodated by cities at each scale was calculates as follows:
- Regional scale capacity (100km) 3.9m
- City scale capacity (10km) 1.0m
- City centre scale capacity (2km) 0.3m
This accommodated over 80% of ONS forecast growth in existing cities, leaving an unallocated population total of 1.1m.
To this point, the process deals only with cities that can accommodate more growth. It has not yet addressed cities above the line of best fit where the spatial densities at 100km are not high enough for the population (such as Birmingham). To improve the regional scale connectivity of cities above the line requires major change. This change could be implemented through transport infrastructure.
This approach follows a principle that a pre-determined model or overall hierarchy of cities will not be imposed, but that growth will be located where opportunities already exist. The two maps below showing where growth has been added (left) and total population (right), show that London remains significantly larger than any other city. Generating or fundamentally changing this existing hierarchy of cities to create a city which is more similar to London, or which creates a more distributed network hierarchy is a major decision with feasibility restrictions (cost, physical) and economic, social and political impacts.
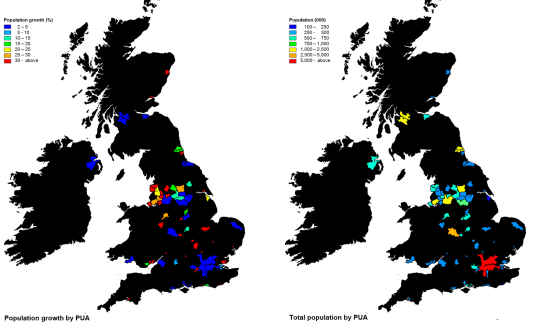
Fig 6. Thematic maps showing percentage growth by PUA (left), and resulting total population (right). Many PUAs recording very high growth rates remain small within the UK hierarchy of cities.
3.4 Discussion
This scenario does not take account of any factors outside spatial characteristics and it has a number of implications that require better understanding.
The spatially driven growth scenario creates something that is radically different. This scenario does not make reference to population or employment trends, but concentrates growth in locations where the spatial characteristics associated with economically successful cities are already in place. Whilst these cities have the infrastructure, they don’t currently have the employment, and many of the PUAs where growth has been allocated tend to be shrinking cities. The reasons for this shrinkage have not been investigated but many have well documented economic struggles. While this approach cannot provide an answer to these issues, it can be used to indicate where policy intervention or incentives are more suitable than physical intervention.
Whilst growth has been assigned to cities with strong spatial characteristics, there remain a number of cities with poor spatial characteristics. This limits the growth to London and other major cities. It also identifies cities, such as London, where spatial infrastructure improvements are required to support the existing population. London itself may be the problem, and it is an outlier in spatial, economic and population terms that there could be argument that it does not set a useful comparison for other PUAs.
This also begins a conversation around both the factors that have been profiled in order to allocate population growth, and the fact that all PUAs have been used to define the target line. With more time available, analysis of factors such as quality of life could have been used. Rather than taking the line of best fit across all cities, which in effect will create more average cities, defining the target line based on a selection of the highest performing cities would make a more robust scenario.
Because existing PUAs were profiled to accommodate growth, the study did not identify any places for entirely new settlements.
Finally, growth was allocated proportionally starting from the regional scale (100km). One of the results of this is that smaller cities between large cities accommodate a lot of growth. This is an interesting subject for further consideration in relation to the debate around what size of city, in terms of population, is optimal. The work of Bettencourt suggests that (positive and negative) outcomes in larger cities are greater, and this would suggest that a strategy should aim to concentrate growth to a few larger cities. By contrast, the result of the approach tried here increases the size of many smaller cities close to large cities, rather than further increasing already large cities. Whilst there are differences between the two studies in this respect, where they share a similarity is that they identify Manchester and Birmingham as underperforming – Bettencourt on the basis of a smaller GDP in proportion to population, our study on the basis of having lower levels of spatial density in proportion to its population.
4.0 Part two – UK infrastructure scenario testing
The key question being studied during this stage of work shifted to whether the right transport infrastructure is in place, at the macro-scale, to support cities and create strong networks of cities. The working assumption is that this can be achieved by providing high levels of residential population with access to high levels of employment opportunity.
Transport connections must not compromise the local scale networks, which must either remain intact or be improved to fully optimise investment in infrastructure and generate maximum benefit. However such benefit is only possible if the macro-scale network is in place to begin with, and this is the subject of this piece of work.
Three questions were investigated through this work:
- How infrastructure proposals strengthen relationships between PUAs, surrounding populations and other PUAs, and;
- How infrastructure proposals improve access to employment opportunities across the country?
- What transport infrastructure intervention is required to create the best outcome?
In answering these questions a total of eight infrastructure scenarios were developed and tested (shown below). However this section does not concentrate on showing how these were generated, or how they performed, but instead talks about the methodology used to model and analyse them, and some of the findings on existing conditions.

Fig 7. Infrastructure scenario options tested (proposed improvements shown in red).
4.1 Methodology
The focus of this stage of work was on the impact of transport infrastructure in terms of access to a working population, and access to a number of jobs. The major measure was therefore based on understanding the catchments of PUAs through all modes of transport, and the number of people and jobs within these catchments.
A consistent measure of cost is required to combine the impacts of travel on foot, by car or by train. As the decisions involved in navigating on foot, by car and by train are different, time cost was used to calculate isochrones rather than metric or angular cost.
For this piece of work the spatial model from the earlier growth scenarios study was developed further by adding the entire UK rail network, adding additional unlinks to separate this from the road network and adding speed to every node in the combined network.
Each network has a categorised hierarchy, allowing average speed assumption to be added to each element of the network. The road network (generated from the OS Meridian line) consists of four categories of road, each with a different speed limit. Assumptions on speed have been applied at 80% of the speed limit:
- Motorways (56 mph or 90 kmh)
- A Roads (48 mph or 77 kmh)
- B Roads (20 mph or 32 kmh)
The rail network was assembled from different sources including Ordnance Survey, High Speed 2 Limited and One North 2014. Each category of rail line was then allocated the following assumed average speeds, based on around 80% of maximum speed:
- High Speed railway (100 mph or 161kmh)
- Principal railway (60 mph or 97kmh)
- Local railway (30 mph or 48kmh)
Further population and employment data has been added to enable time-based catchments from each PUA allowing relationships between employment and population to be used as the basis for a scenario comparison. The InFuse LSOA dataset, containing more than 40,000 areas covering the whole of the UK and Census data were used to add population data. Employment data used in this study is limited to that found in PUAs, which accounts for 59% of total UK employment (Cities Outlook 2015) ref http://www.centreforcities.org/publication/cities-outlook-2015/ .
Using the Integrated Model, the population and employment within one hour of each PUA (using all modes of transport) was calculated for a Baseline Scenario, then for additional scenarios in which changes to the rail network have been made.
This was carried out using ArcGIS Network Analyst to build the network then generate a catchment for each PUA. The resulting catchments were then used to carry out a series of queries which include:
- residential population within a 60-minute catchment of each PUA
- employment numbers within a 60-minute catchment of each PUA
- access to PUA based employment from all LSOAs
These results can be visualised showing where catchments overlap (1), colouring all PUAs according to population or employment within these catchments (2 + 3). A more complicated process was used to sum the PUA based employment opportunities within an hour of all parts of the UK shown at LSOA level (4). All of these measures could also be visualised as scatters and graphs.
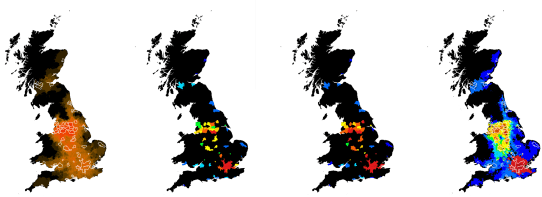
Fig 8. Visualisation of integrated model. 60 min catchment from all PUAs, darker colours indicates an overlap of more catchments (Left), PUA based Population within 60 mins of each PUA, with red showing higher and blue showing lower numbers (centre left), PUA based jobs within 60 mins of each PUA, with red showing higher and blue showing lower numbers (centre right), and, total number of PUA-based jobs within 60 mins of every LSOA in the UK, with red showing higher and blue showing lower numbers (right).
4.2 Existing results
Scatters of existing population and employment within an hour of all PUAs are shown below:
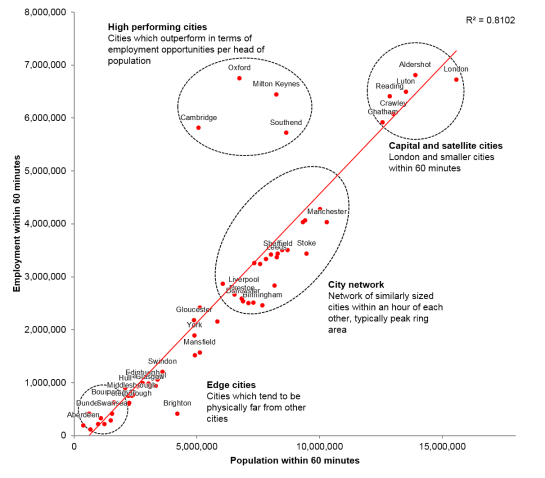
Fig 9. Scatterplot profiling all PUAs against the number of jobs and number of residents within 60 mins journey.
This reveals four clusters which can be loosely characterised as follows:
Capital and satellite cities
The highest populations and employments are found in London, however the smaller PUAs of Aldershot, Crawley, Luton, Chatham and Reading benefit significantly from their proximity to the capital, making them satellites. Capital and satellite cities already share population and employment, limiting immediate catchment benefits from improved railway infrastructure.
City networks
Cities within the peak ring are grouped together in the middle of the range of population and employment figures. Due to the physical proximity and strength of the connections between them, their opportunity to have access to higher numbers of jobs and employees is exploited by improved railway infrastructure between the cities.
An interesting comparison can be seen between the Peak Ring cities and London; while the Peak Ring is formed from many PUAs, providing access to a greater number of cities, the number of jobs within these cities is not as great as within London. In terms of proximity to employment, there is a major benefit to being within the South East.
Edge cities
The lowest population and employment figures are found in the more isolated PUAs. Cities in the North East of England and Scotland, are so far from other PUAs and other settlements) that improvements to infrastructure (at current levels of “high speed”) may not be enough to connect them to more people or jobs.
High Performing Cities
A cluster of Cambridge, Oxford, Milton Keynes and Southend can be seen to provide far higher amounts of employment to population than is proportional elsewhere. There may be a range of factors influencing this: a catchment analysis will always create a threshold effect where some cities are either just inside or just outside a boundary, these cities all fall within the catchment of London. Because datasets have only been used at the PUA level, these cities may be supported by a range of smaller settlements that are outside the definition of a PUA (and so are invisible in the data) but which still hold a relatively large population.
4.3 Scenario testing
A total of five alternative scenarios were generated and tested by adding new rail links or increasing the speed on existing connections. Assessing the impact of scenarios could best be done using the LSOA level analysis of employment within 60 minutes, and the corresponding graph.


Fig 10. Impact testing scenarios using maps to visualise employment within 60 mins of all PUAs, and graphs to compare options in terms of the cumulative percentage of residents within an hour of PUA based employment. In the most well performing option 40% of UK residents could have 10% more jobs within an hour.
Without going into the detail of each scenario, general findings across the country were that most improvements could be seen in the middle of the distribution. That is, the cities with access to a high amount of employment were not seen to benefit too much, neither were those with very poor access.
This would explain what is happening to the Capital and Satellites, and Edge Cities clusters described earlier. The edges are so far from anywhere that without major increases in train speed, an hour’s journey does not reach any significant PUAs. This could partly explain the case with the Capital and Satellites: the network has already developed to create multiple strong connections to London, and while some improvements might connect parts of Birmingham to London within an hour, the location of the station and integration with local scale networks does not make a significant impact on the country wide access to jobs.
The parts of the distribution where improvements can be most clearly tend to be where changes to the network have strengthened connections between cities that are physically close.
4.4 Discussion
This catchment-based analysis of the UK’s system of cities presents an interesting counterpoint to the discussion on the distribution of city size by population. The UK has a long tail distribution of city size by population, however when it is profiled in terms of the number of employment opportunities and population within one hour, the shape of the distribution becomes much more linear. One interpretation of this finding is that the UK’s cities work in smaller, regional scale networks of cities, rather than as a singular national scale network.
There are also exceptions such as Oxford, Cambridge, Southend and Milton Keynes which have proportionally lower residential populations but a very high number of jobs. As with the Growth Scenario work, this may be the impact of PUA level data obscuring the relationship to networks of smaller supporting towns and villages.
Using this more sophisticated description of cities and city networks, again, we find similarities with the work of Bettencourt, specifically that Birmingham and Manchester continue to under perform against the average (defined by the line of best fit) when the number of jobs within an hour are plotted against the population within an hour.
There are of course limitations to this methodology; when catchments were run, they were based on travelling as far as possible within an hour only taking speed into account. Analysis does not therefore take into account considerations such as capacity, frequency of service, congestion, financial cost of service etc. While this creates some restrictions, it could be argued that it provides a useful understanding at the strategic level of decision making by showing the potential reach of cities. Considerations of cost, frequency and capacity do need to be taken into account, and these will affect the ultimate success of the project, however they inform issues of how the infrastructure is operated and used, rather than where it is and what it connects.
The measure of PUA based employment within an hour of every LSOA is interesting within the UK context. An established measure used within transport planning is the Travel to Work Area (TTWA). TTWAs are generated through the census and other surveys, and effectively provide a snapshot of where people live and work at any one time. This is likely to pick up the impact of some of the issues listed above such as cost and congestion. However, what TTWA do not show is the potential of infrastructure to connect people to other jobs. As a result, using it to make strategic infrastructure or planning decisions runs the risk of missing existing opportunities. Using the Integrated Model to calculate these “potential” travel to work areas can start to address this issue.
5.0 Limitations
There are some significant limitations to both elements of this work:
At the point in time when this study was carried out there were very few pieces of work within the Space Syntax community addressing either similar scale or outcomes. Consequently the work has been based on three measures that were identified as significant by Sera, Hillier and Karimi (2014). Working within the constraints of a short project, there was also very limited time or resource to spend on further, detailed exploration.
As a result the methodology should be caveated as being highly experimental in nature; it has been developed around only three very simplistic analyses for which it is very difficult to verify the impact of. Longitudinal analysis to validate the relationships between changes in the characteristics of the three analytic measures used here, and socio-economic outcomes would help. However, collecting the data required over the time scales involved in this level of city change, in a UK context, and to identify the causal mechanism would be difficult. It should also be re-stated that the aim of the work was to stimulate new thinking in relation to growth rather than to generate a new scenario which was only subtly different to those which emerge through the conventional methods.
6.0 Conclusion
Throughout both pieces of work the Integrated Urban Model was very useful. It allowed high level modelled output of multiple scenarios to be produced very quickly (within a matter of a few weeks), enabling discussion of scenarios and impacts to move beyond personal interpretation far more quickly. The range of output visualisations also proved very useful to work with a range of people from different professional backgrounds, each with their own preferences for statistical or graphic outputs.
In considering the suitability of this approach for other projects the issue of threshold effect has been raised and discussed. One approach which remains to be tested is to generate catchments across a range of thresholds, including for example 30 minutes, 60 minutes and 90 minutes. The resulting profile of how a city performs across many scales may help to develop the characterisation of cities further and remove some of the anomalies.
In addition, profiling cities against a range of outcomes should also be considered. Economic impact is one of many outcomes of a city, and in considering which cities we should learn from, we must also consider social and environmental outcomes. It should also be reiterated, that the strongest performing cities against these criteria should be taken as the basis for making changes to population, rather than the average.
Finally, the two studies could have benefitted each other if there had been an opportunity to revisit the growth scenario having carried out the transport modelling. This would have added an additional layer of sophistication and allowed a more complete scenario to be generated.
An interesting point of our work is the exploration of the concept of scaling from a network perspective firstly and how that could help us make urban planning decisions secondly. The work of Bettencourt measures scaling between the population and the various socio-economic-functional parameters of cities such as GDP and patents within an urban area boundary. A critique of Bettencourt’s work is the use of an urban boundary in measuring population where in reality the functional boundary of any city might be really different. Interpreting our work from a scaling perspective will allow a much better understanding of how population scales with different socio-economic parameters. For example, if instead of using population within a predefined urban area boundary we are measuring population within the network functional boundary, do super-linear scaling relationships still hold? This has great implications on the benefits of density and agglomeration. As a result, more work is needed to understand how this works relate to the scaling literature.
Since completing the work it has subsequently been presented to the Department for Communities and Local Government, the Treasury and the Department for Transport. In most cases, whether the discussion was in the context of housing or transport, conversation turned to opportunities to make “quick wins”. This underlines a major benefit of this approach, which is not just to make decisions based on an understanding of what spatial characteristics affect how cities work, but the potential to identify existing opportunities that cannot be picked up through current statistical methods used to allocate growth.
Acknowledgements
We gratefully acknowledge the Government Office for Science for funding the initial work, and Space Syntax ltd for providing the time to write this paper.
References
Bettencourt, L. and West, G. (2007) A unified theory of urban living. 2010 Oct 21;467(7318):912-3. doi:10.1038/467912a.
Bettencourt, L. (2013). The Origins of Scaling in Cities. Science (340) 1438-1441.
Bettencourt, L. and Lobo (2016). Urban Scaling in Europe. Journal of the Royal Society Interface. (13)116.
Harding, A, Marvin, S and Robson, B, (2006) A Framework for City-Regions. London: ODPM. (Available at:www.communities.gov.uk/urban)
Hillier, B. and Hanson, J. (1984) The social logic of space. Cambridge, MA: Cambridge University Press.
Hillier, B. (2006) Space is the machine. Cambridge, MA: Cambridge University Press.
Hillier, B. and Iida, S. (2005) Network and psychological effects in urban movement. In: Cohn, A.G. and Mark, D.M., (eds.) Proceedings of Spatial Information Theory: International Conference, COSIT 2005,Ellicottsville, N.Y., U.S.A.,September 14-18, 2005. Lecture Notes in Computer Science (Vol. 3693). Springer-Verlag, Berlin, Germany, pp. 475-490
Hillier, B., Yang, T., Turner, A. (2012) Normalising least angle choice in Depthmap – and how it opens up new perspectives on the global and local analysis of city space. JOSS 2012 P155-193
Hillier, B. and Serra, M. (2014) Spatio-Structural Correlates at the Regional and National Scales. Presentation at the 21st International Seminar on Urban Form.
Hildreth, P. A. (2006) Roles and Economic Potential of English Medium- Sized Cities: A Discussion Paper, Salford University of Manchester
Serra, M. and Hillier,B. and Karimi,K. (2015). Exploring countrywide spatial systems: Spatio-structural correlates at the national scale. Proceedings of the Tenth International Space Syntax Symposium, London UK, Paper 084
Versluis, L. and Law,S. (2015). How do UK regional commuting flows relate to spatial configuration? Proceedings of the Tenth International Space Syntax Symposium, London UK, Paper 074
Government Office for Science (xxxx). Foresight Future of Cities project. Publisher needed. https://www.gov.uk/government/collections/future-of-cities
Centre for Cities (xxxx) Title and publisher needed. http://www.centreforcities.org/publication/cities-outlook-2015/
Copyright Ed Parham, Stephen Law, Laurens Versluis (2017)
