Health, Urban Form and Modelling
This post is a summary of a presentation I gave at the BRE Cities Regeneration Conference.
What does health mean?
At the moment there’s a lot of press attention on obesity, but health is much more complex including: communicable and non-communicable illness (Non-communicable include Obesity, Diabetes, Cardio Vascular, Respiratory and Mental Illnesses), causation and correlation, “hard” and “soft” urban systems and complicated versus complex.
The key question for urban design and planning is: (How) does urban form impact on health outcomes?
Obesity
Obesity is a good example, partly because it attracts a lot of attention in the media, and also because it’s complex.
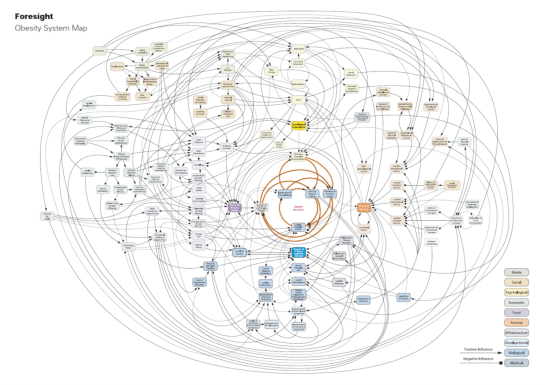
At the top of the post is a system map of factors influencing obesity put together by the GO Science Foresight team around 2007. It shows all sorts of factors influencing Obesity from a huge range of areas including economic status, type of diet, psychology, metabolism etc.
Of all of these factors, walkability – which from here on will be used to define the relationships between the spatial network, density, land use, and public transport – is only a very small part.
However, while it’s a small part, it’s a part that is very difficult to change. It affects infrastructure, land ownership, utilities, public transport, and is consequently, slow and (politically and financially) expensive to change. It is also the part that Architects, Urban Designers and Planners have a chance to influence and so should be understood properly.
Obesogenic urban environments
To counter the view that the urban environment is only a small contributor to Obesity, and as an illustration of some of the slightly contradictory research findings that exist in this area, a subject covered in a number of papers is the Obesogenic urban environment.
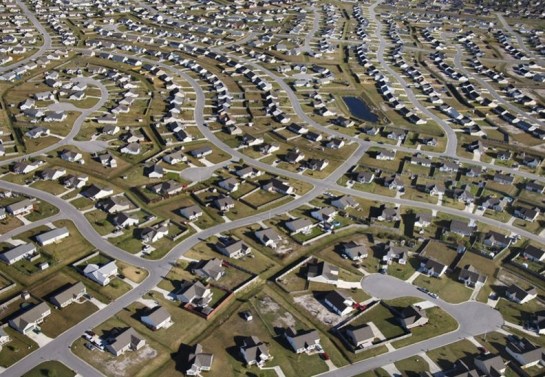
A very broad definition is that this an environment that has a set of urban characteristics that are associated with higher levels of obesity.Typical Obesogenic environments combine low density sprawl with single uses, cul-de-sacs and a lack of public transport. In short they make it very difficult not to drive.
The urban factors generally thought to counter obesity include higher density, good connectivity, good public transport access, mixed land uses, access to green space, access to sports facilities, perception of safety, and a feeling of community.
There are however a number of complications:
Complication one
Most research is from Europe, Canada, the US and Australia.
Because cities are complex systems combining infrastructure with social and economic systems and people, relationships between urban form and obesity aren’t consistently found in all of these places. There are exceptions between countries, between cities in the same country, and in different parts of the same city.
Bottrop in Germany is an example of this. Two parts of this city were seen to have the same urban conditions (which were not associated with obesity) but were found to have completely different levels of obesity – one healthy, one with high levels.
When this was looked in to in more detail one of the major differences was that a community of non-German speakers lived in the area with higher levels of obesity, and weren’t able to read the ingredients in processed food.
There is also a socio-economic aspect which has been identified, where higher levels of obesity are associated with the more deprived areas measured through the Index of Multiple Deprivation.
Another issue is how studies are communicated. While a research paper might not find the precise relationship the study was testing for, it may not mean the opposite is true.
Finally there is a question about consistently measuring urban form, which we’ll get to shortly.
Complication two
Stepping back from obesity, research shows that what might be good for one condition may exacerbate another. As an example; higher density is associated with lower levels of obesity, however it is also associated with higher levels of mental health problems.
Walkability is associated with lower levels of obesity, however it can also be linked to higher levels of respiratory problems (when the more walkable areas are close to busy or polluted roads).
Complication three
Finally, there’s the issue of communicable vs non-communicable illness.
Someone who lives in a slum which is walkable, mixed use and dense, may not be obese, but they may also contract a terminal communicable illness.
Measuring urban form
One problem is that cities are big, complex, combinations of hard and soft systems, each of which is difficult to explain in a meaningful way by itself, and even more difficult in combination.
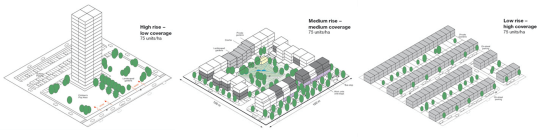
A study in the states associated higher density with a reduction in levels of obesity, however the increase in density was from 8 dwellings/acre to 20 dwellings an acre, or an increase from 20 d/ha to 50 d/ha – densities that are not especially high in urban areas in Europe.
The urban task force produced very clear diagrams (above) showing how the same density can be arranged in many ways. Each of these arrangements would create major difference between what these areas would actually be like to live in, where activity would be focussed, how easy it is to walk, how easily you can get to public transport, get to work etc.
A measure that is often used alongside density to measure the layout of the streets and spaces is junction count per hectare. However, like density a layout can be arranged in many different ways yet still record the same value. As with density, each of these arrangements will have a major impact on the area.
This is where urban modelling provides an opportunity to be more precise about measuring cities.
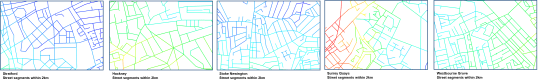
The next section uses five parts of London (Stratford, Hackney, Stoke Newington Common, Surrey Quays and Westbourne Grove), chosen at random, to show what these measures can mean in reality, and to think about how they can be improved.
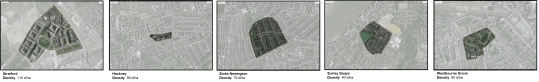
Density (dwellings per hectare)
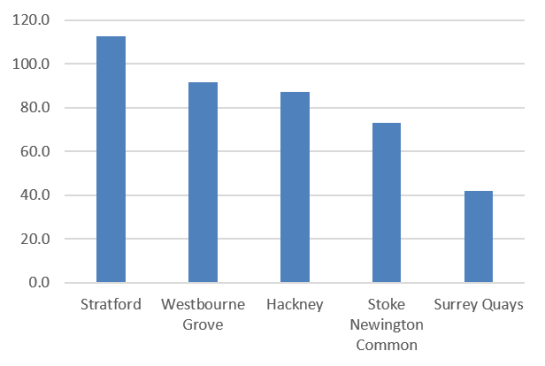
Density (y axis above) is a reasonably well know measure that is familiar to everyone working in the urban environment. I set out some thoughts on the way that density is typically measured, and why it might be necessary to develop some new thinking here and here.
All of these examples would be on the high end of the scale in relation to the US based study mentioned earlier.
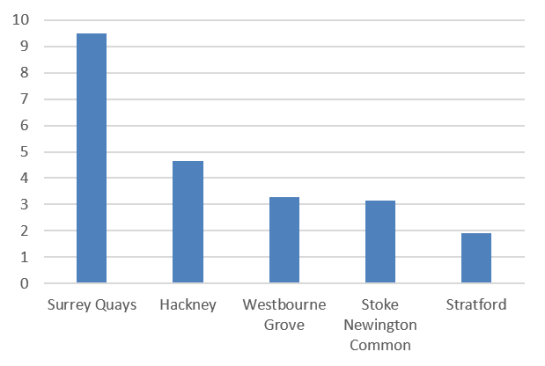
Junction count per hectare
A measure that starts to describe the layout of streets is junction count (y axis above). For this measure the number of junctions within a defined area is counted and calculated per hectare.
Better connectivity is associated with more walkable environments and lower levels of obesity, therefore the higher the junction count should mean the better the layout. On this basis Surrey Quays should be better than Stratford. However these areas are almost the exact opposite of each other, Stratford is a dense, continuously connected urban grid, while Surrey Quays is a low density set of cul-de-sacs and dead ends – closer to the obesogenic conditions.
So while junction count gives a very high level description of a network, it’s possible for poorly performing areas to be masked. It also treats areas as discrete zones without explaining anything about the wider network itself such as how it connects to other areas.
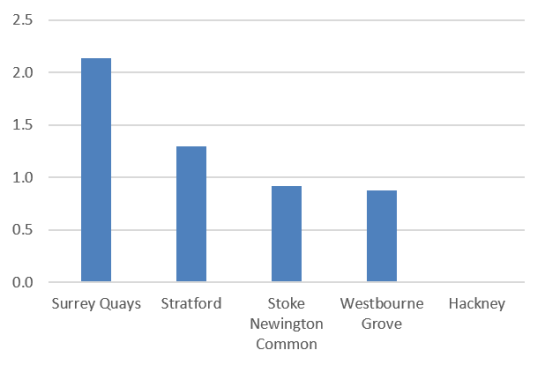
Length of street per dwelling
By using a model of the spatial network it’s possible to measure things in more detail. Before getting in to space syntax, segment based, measures we’re going to continue to look at discrete areas. In this case we can look at the length of street per house (y axis above) as a way of beginning to think about how active the space is and how dense.
Research on factors influencing walkability outlined characteristics such as permeability, land use mix, density etc, but also the perception of safety. Earlier space syntax research has shown that over permeable layouts – those where there is a high number of routes but a low number of people to populate them – feel unsafe and are often where anti-social behaviour occurs. By looking at the length of network and relating this to the number of households, we can begin to benchmark where layouts may be inactive, and we can look at average distances between households.
In this analysis Surrey Quays has the highest length of street per house, by contrast, Stratford has the least distance between houses, implying there would be higher levels of activity in Stratford.
While this measure can profile discrete areas it doesn’t explain how well an area is embedded in its local context .
Spatial Layout density 800m
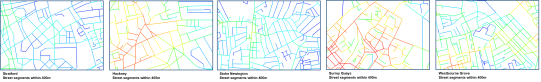
Another very simple measure of layout is Spatial Layout Density (or node count). This can be run at many different scales to calculate the number of street segments within a defined radius of each street.
The measure is very simple and is calculated individually for every single segment which means it both picks out the very fine scale differences between street segments that can be missing from analysis of discrete areas, and it works across boundaries removing any edge effects. This starts to make a big improvement on measures such as junction count as it begins to talk about how the network of spaces are actually structured.
Another issue this links to is neighbourhood walkability. The physical area of a neighbourhood is something that varies between papers – in many cases it is defined as roughly 800m from home. However there is specific research (Hillsdon et Al) that shows most exercise is undertaken at least 1200m from home, this means either that the definition of a neighbourhood should be considered much larger, or that no one exercises in their neighbourhood.
A further, potentially more important issue is that focussing on the neighbourhood ignores the wider question of where people work, what the urban environment is like there, the links between an individual’s neighbourhood and the wider city. The danger is that without understanding these part/whole relationships we end up with very ‘walkable’ neighbourhoods which are essentially gated from the wider city and which still rely on the private car.
Spatial layout density 2km
Using street segment models starts to allow these multi-scale relationships to be measured more accurately, and hopefully to understand their impacts more clearly.
Research across the UK has found that most jobs are in areas where the number of street segments within 2km is above a threshold (Serra et Al). Furthermore, the number of streets within 10km has a relationship to population distribution.
Using only a street segment model we can start to use these measures as high level proxies to understand wider relationships. By using the same measures to look at how many streets are within a bigger radius we can begin to see how close neighbourhoods are to centre of town, and get idea of where jobs are found.
From these two components we can see how walkable an area is locally, and also how close it is to city centre jobs.
Spatial accessibility 10km
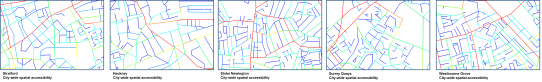
While we can see where the pockets of employment are likely to be, and how walkable a neighbourhood is, the next set of conditions to look at is the strength of connections in, out and through an area.
Spatial Accessibility (betweenness centrality) measures how useful each street is to connect everywhere to everywhere – this is the ‘workhorse’ measure we use most in day to day work, it typically correlates well with movement and also land use. So this allows us to see how strongly each area is connected to the wider network of the city.
From these examples we can start see that to describe the urban form of city we need to look at a range of characteristics simultaneously. These measures only use the configuration of the street network, and while they are reasonable proxies for a number of characteristic, they do not take account of things like public transport routes, congestion, density or land use. It is possible to add these systems using Integrated Urban Models.
What should we do?

So far this has only spoken about more precise descriptions of urban form, and we don’t know exactly how this relates to obesity – so is this useful to tackling health issues?
There are lots of unanswered questions around causal relationships, complex systems, consistent measures, how research is reported, how to address problems (even in the same paper), and this is just for obesity.
However, if the problem is complex it doesn’t mean we shouldn’t try to address it as the long term risk is high – childhood obesity for example.
The urban environment is difficult to change and takes a long time. While there may not be consistent associations between good health and urban form, behaviour change is impossible if the urban conditions dont allow – e.g. if you live in the suburbs in America its impossible to walk to work. This means that for demographics who don’t have the income or time to spend their leisure time exercising that it makes it more difficult to avoid poor health.
If we know the conditions that tend to be associated with unhealthy environments, we can avoid recreating them, this means connected street networks, mixed uses, higher densities, better public transport connections. These characteristics are also found in the places which are more vibrant, economically successful, safer parts of the city.
So because we need to do something, because urban form is difficult to change, and because getting it wrong makes some behaviour change impossible, we have to think about urban form. As designers who influence the environment we need sophisticated ways to understand how it works. If we know this, can work out how it may be affected by future changes – and this is where modelling comes in.
Technology and data provides us with an opportunity to look at things in a way we haven’t before – in complex systems, at many scales, to look at data longitudinally, and in relation to many issues – however this might be the easy part. It also needs a change in the way that the planning, design and operation of cities is carried out – to work across silos, to use these tools, to develop data literate skill sets. And these things need to become standards, not just the things that the cutting edge of a profession do.
Bibliography
Air pollution: outdoor air quality and health, National Institute for Health and Care Excellence
An assessment of the relevance of the home neighbourhood for understanding environmental influences on physical activity: How far from home do people roam?
Melvyn Hillsdon, Emma Coombes, Andy Peter Jones
Cities Afoot—Pedestrians, Walkability and Urban Design, Ann Forsyth, Michael Southworth
Exploring countrywide spatial systems:Spatio-structural correlates at the national scale, Miguel Serra, Bull Hillier, Kayvan Karimi
Health And the Built Environment: A Review Prepared for: The Canadian Medical Association, Lawrence Frank, J. Armand Bombardier, Sarah Kavage, Andrew Devlin
Obesogenic urban form:Theory, policy and practice, Tim Townshend, Amelia A.Lake
Space is the Machine, Bill Hillier
Space Syntax and Walking in a New Urbanist and Suburban Neighbourhoods, Perver K. Baran , Daniel A. Rodríguez & Asad J. Khattak
Tackling Obesities: Future Choices – Obesity System Atlas, Government Office for Science
The impact of urban form on public health, Billie Giles Corti
The non-linear health consequences of living in larger cities Luis E C Rocha, Anna E. Thorsen, Renaud Lambiotte
Urban Design, Mobility and Obesity: A Study of Obesity in Germany, Clotilde Minster
