Developing a spatial framework and geometry


Earlier posts looked at why (master) planning hasn’t worked as intended, reaching one conclusion that the design outcomes weren’t flexible enough. The response was to aim to design the fewest fixed components and allow the city to grow more organically on a plot by plot basis within this framework. Changes in the economic or social context would be reflected by variations in density, land use, massing and speed of growth.
An early outline of fixed components includes solids (blocks, plots) and voids (street, infrastructure, and utility networks). Of course there are a secondary set of requirements that must be provided, but which there is some flexibility in terms of location or exact configuration – these include social infrastructure etc.
This post starts to set out how to develop this spatial framework. Building on Bill Hillier’s idea of the Movement Economy (1) – the configuration of space affects the distribution of people who affects the distributions of land uses and values – the starting point is the spatial network. Space is very difficult to change, with far-reaching impacts, while buildings can be replaced, and land can be bought and sold.
In turn this post becomes an examination into the geometry of spatial networks and urban blocks.
As always these are developing thoughts.
How does the geometry of cities work?
The research of Bill Hillier describes the distinct geometric differences between organic and planned cities. Planned here is shorthand for gridded cities rather than planned cul-de-sac development.
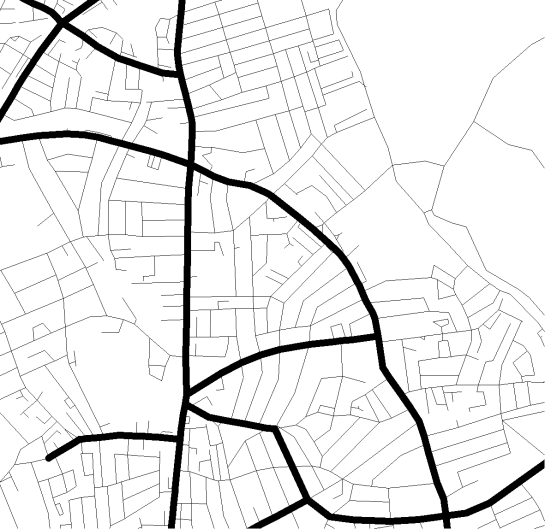
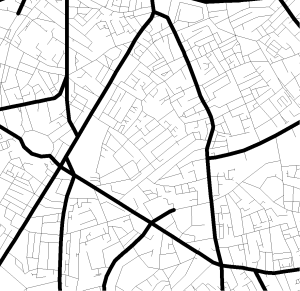
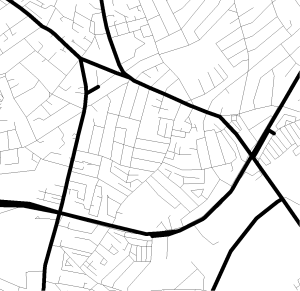
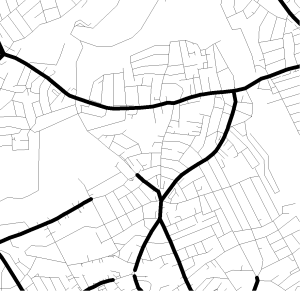
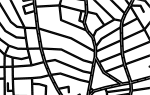
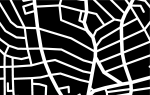
Organic cities tend to have grown from bottom up processes, where the spatial network is formed from a small number of long streets and a large number of short streets. Typically this means that a spatial network is created that has a clear hierarchy which could be characterised as primary and secondary streets. The primary streets are longer spaces that are more connected, collect more movement, and concentrate uses such as shops in these areas.
Organic cities still create continuously connected networks, albeit that the angles between the primary streets are rarely 90 degrees. There are very interesting properties in terms of legibility in these cities – you can see where to go from the ground rather than from a map. As they were developed from the bottom up the resulting geometry may not have clear order when viewed in plan, however on the ground there is a logic – the further you can see the more parts of the city you can reach easily, and this is because the foreground is made up of long streets that don’t tend to end at 90 degrees.
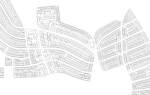
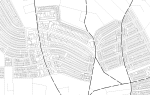
Planned cities are the result of top down processes. There is a less clear hierarchy in the spatial structure, although there is visual order when viewed in plan, and this can be an easy image to hold in your head when walking around. In terms of a spatial hierarchy; the highest spatial accessibility values are often lower than in organic cities, but the average across the whole city is higher (2). In one sense this means that all parts of the city have access to more similar amounts of potential movement.
Triangles and Rectangles
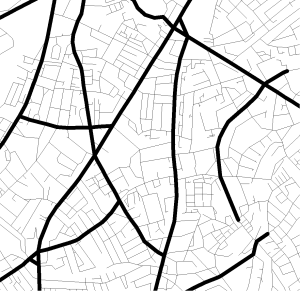
There are clearly different processes behind these geometries. The less regular geometries of organic cities are the result of people moving between points taking the shortest route. These become primary routes. Where these primary routes cross are often the points at which opportunities for wider interaction develops and the grid intensifies to become a centre. Something key to Hillier’s work is that centres tend to emerge which are linear in nature, developing as frontage on either side of the street, rather than an internalised, block based centres which operate in isolation from the street.
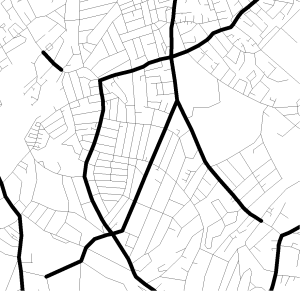
Because these primary routes cross in places by chance, or reach a single point, they rarely create right angles between them. The route itself may change direction slightly in relation to local conditions such as gradient or flooding, however it is often (but not always) possible to identify triangles as the basis for the super blocks created by the primary network.
The secondary network that emerges within these triangles has often been planned, but even when it hasn’t, the division of these blocks tends to be based on creating perpendicular junctions around the perimeter, and extending secondary routes in to the triangular block. Sometimes these secondary routes may extend continuously across the boundary of the primary block but not always.
Obviously planned cities are the result of a conscious effort to define them (divide, parcel, allocate, mass) and the easiest way to do this consistently is through a top down overview.
In planned cities the differences between primary and secondary networks are more difficult to identify – being defined more by road hierarchy and planned land use than geometry – and tend to be based much more around streets intersecting at right angles. There are less clear differences between the primary and secondary networks, although even within the geometry of equally spaced grid there are parts that are closer to everywhere else.
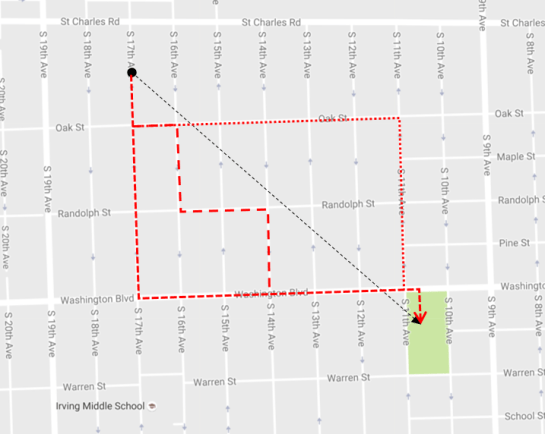
Because grids are easier to imagine they take a lot less description. On one hand this makes them easier to navigate against an image in your head, while on the other it is more difficult on the ground as you probably can’t see the point you’re trying to get to (requiring “L” shaped journies instead of largely straight journeys).
When, why and how did cities change?
In Nature, Strano et Al (3) use an example in Italy to set out how spatial networks changed over the last 200 years from rural to urban structures. It identified many findings, of which the following four are interesting to this conversation;
- a wider scale “backbone” remained consistent throughout the development,
- as spatial networks became more urban the number of four-way junctions increased,
- the distribution of block shapes changed from more triangular to more rectangular, and;
- the length of new streets added were very short.
The paper hypothesises that the role of the backbone is exploration, and the role of the shorter more regular blocks is intensification. This change to the four-way junction and increase in rectangular blocks also overlaps with the formalisation of city planning, and the development of the professions and disciplines associated with it: planning, traffic engineering, large-scale real estate development.
In organic cities, the primary network was the result of movement between two points, which resulted in irregular grids and triangular superblocks. This is worth remembering as the grid and blocks are the result emergent, bottom up behaviour.
It defines a large-scale network that gets sub divided and built out, and the irregularity of the grid is accommodated by the flexibility of buildings to adapt to irregular shapes. Walking around older cities there are very few buildings that occupy completely square plots.
As city making has formalised and shifted towards creating more rectangular geometries, are there any advantages?
Benefits of rectangles
Although rectangles have been the basis of planned since at least Roman times, there are a number of contemporary preferences given to them:
- From a traffic engineering point; when roads meet at acute angles, it means looking almost behind to see approaching traffic. In a rectangular grid, all roads meet at 90 degrees, meaning every approach can see equally well.
- From a property/real estate point, rectangular blocks are easier to translate into rectangular buildings which means easier plans to measure, and easier, more adaptable floor plates to fit out.
- From a mathematical point the surface area to volume ratio is more efficient for cubes compared to prisms. This means less energy lost through facades, as well as less façade to build in the first place.
While this shift has been observed, it doesn’t mean it has necessarily had a positive impact.
What is the ideal geometry for a city?
As geometries have become more regular, they have moved away from the logic that formed them to begin with. Cities become less easy to navigate on foot by people. Even if mobility technology develops to become automated, accessible and affordable across the entire city scale, the city shouldn’t be shaped only by this technology. Over depending on the current state of the art is risky in that it doesn’t predict disruptive technology, and can lead to under developing other parts of a design. One thing that wont change is that people will move physically through space based on what they can see, and developing city infrastructure around this should be the starting point. Other technology should adapt to these traits, not replace them.
However, there are undoubtedly advantages to rectangular plots. By looking at the roles of the spatial network at different scales it might be possible to develop a better approach that merges the two.
The primary route network is about moving across the city. This predominantly follows shortest paths, but may respond locally to steep gradients, areas that flood etc.
The secondary grid is about dividing up the primary grid in to more regular pieces of land. This can be done by defining a preferred range of block sizes for primary routes, creating perpendicular routes at these points and then extending them until they meet another secondary route.
This seems a very simple way of combining the roles of each network, and the geometry it applies to do this. It combines the benefits of each – a movement network that develops from the characteristics of people and the requirements to move across cities but also creating regular, efficient plots. There will always be parts of the city where the networks meet at angles outside 90 degrees, but these can be managed, and perhaps these should more suitable targets for automotive vehicle technology than the whole scale re-imagining of a city.
Does this geometry happen anywhere?
This characteristic can be seen in many cities, London provides many examples. Where two secondary routes meet at angles that are not 90 degrees, the loss of value is mitigated by the fact that the irregular plots are located mid-block on the background network and already lower value.

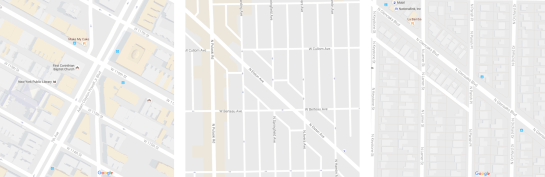
Even planned, regular gridded cities such as New York, Chicago, and LA for example combine these geometries. An argument could be made that these cities mitigate the impacts of merging two networks less positively. When the regular grid is essentially broken by the older organic routes it creates irregular blocks that can be difficult to develop. Because these changes happen on the primary grid, the loss of value is higher. Where the foreground grid is optimised, the background becomes fragmented making movement more difficult.
How to do this in practice?
To apply this type of approach to planning and design requires the use of very specific tools and processes. Geometries can of course be designed and planned by hand, but more generative and analytic tools offer the chance to respond to many pieces of information simultaneously and consistently.
If the foreground network is the result of bottom up movement between places, then tools are required to simulate movement and generate this network. This can be done, and indeed was tested a few years ago here on a hypothetical plot (to critique this earlier piece of work, the size of the site is too small as much of the primary network already exists, although there are parts that work well such as the generation of a network and the distribution of density).
The primary grid then needs to be split into suitably sized block frontages to generate the start of the secondary network. These points then need to be extended at a perpendicular angle from the primary network until they meet another secondary route, then smoothed. Again this can be done.
So the geometry of the spatial network can be generated, but the most important step is to understand how it will be used. The network can be analysed to understand the emerging hierarchy, and this can be used to understand how movement will be distributed and how a street should be designed to respond to it – to be clear on this; it does not mean making a six lane highway that allows cars to move at 80 mph as a response, but creating mixed mode streets that are enjoyable for people to use and which allow street based urbanism to develop.
This analysis also identifies which plots will be more valuable, where there will be more demand for higher densities, commercial uses, and which parts of the city are more likely to go through change and redevelopment more quickly. These can be grouped together in to plot typologies. Understanding this becomes very important when considering some of the issues raised here, allowing cities to identify areas where particular uses are more likely to succeed, where higher densities are more sustainable, where more or less regulation is required, and allowing them to respond more quickly to rapidly changing conditions. It should be stressed that this approach to generating geometry would be consistent whatever the governance structure, and has tried to learn from how cities develop over time to short cut a process of trial and error.
The output from this process can be simplified in to a set of centrelines and plot boundaries. This is not a masterplan in the conventional sense, and there will be questions about how it can be used in reality.
One answer is that it becomes the basis for a development scenario. This would take a defined population and/or employment scenario, and apply street typologies to the spatial network (based on hierarchy) and building typologies to the plot typologies, in effect applying buildings to a site. These can then be designed in detail and built at the right time.
This process allows both foreground and background grids to work together in an optimised whole, while also allowing development strategies to respond to emergent patterns of use.
As noted before, a set of centre lines and plot boundaries may not look like much of an outcome, however to make it this simple requires a deceptively complex process.
There will be more specific pieces on the tools to do this in future, as well as a more detailed investigation into which city systems form part of the framework.

References
1, Hillier; Cities as Movement Economies
2, Hillier, Yang, Turner; Normalising Angular Choice
3, Strano et Al; Processes governing evolution of road networks

Pingback: How should the cities of the future be designed? | D.A.S.